Logo
programming4us
programming4us
programming4us
programming4us
Home
programming4us
XP
programming4us
Windows Vista
programming4us
Windows 7
programming4us
Windows Azure
programming4us
Windows Server
programming4us
Windows Phone
 
Windows Server

SharePoint 2010 PerformancePoint Services : Dashboards in Dashboard Designer (part 2) - Dashboard Zones & Dashboard Pages

- Free product key for windows 10
- Free Product Key for Microsoft office 365
- Malwarebytes Premium 3.7.1 Serial Keys (LifeTime) 2019
4/12/2011 6:03:28 PM

Dashboard Zones

You 
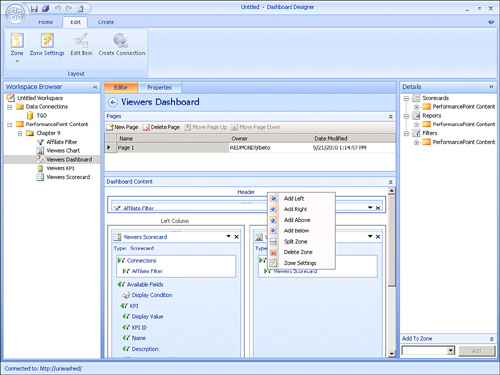
can add, remove, and split zones as necessary on a dashboard. To do this, right-click a zone, and then choose the appropriate selection from the context menu, as shown in Figure 9.

Figure 9. Use the context menu to add, remove, and split zones.

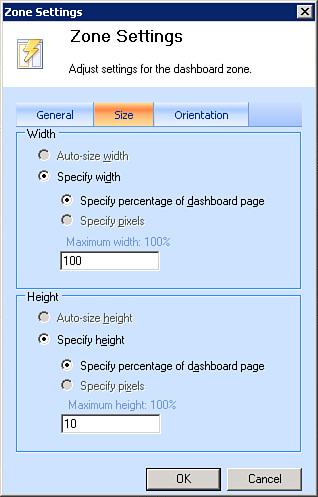
You can access the zone settings dialog from that same context menu, as shown in Figure 10. The Zone Settings dialog has three tabs:

  • General: Enables you to change the name of the zone

  • Size: Enables you to change the width and height of the zone

  • Orientation: Enables you to specify whether the zone should be oriented vertical, horizontal, or stacked

Figure 10. You can also use the Zone Settings dialog to adjust settings.


The stacked option enables you to stack PPS elements on top of each other. In Figure 11, two reports have been added to the same zone, and the orientation option has been set to Stacked.

Figure 11. Use the Stacked option to stack PPS elements on top of each other.

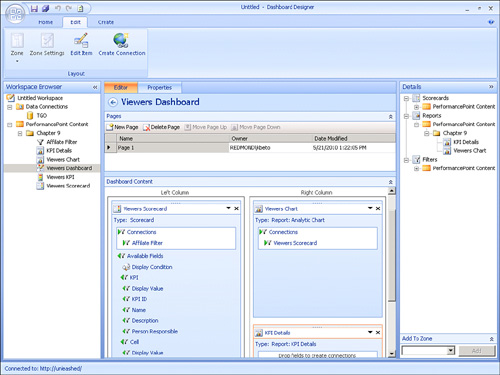
Figure 12 shows the result when the dashboard has been deployed.

Figure 12. This is an example of a stacked setting as it appears on the dashboard in SharePoint.

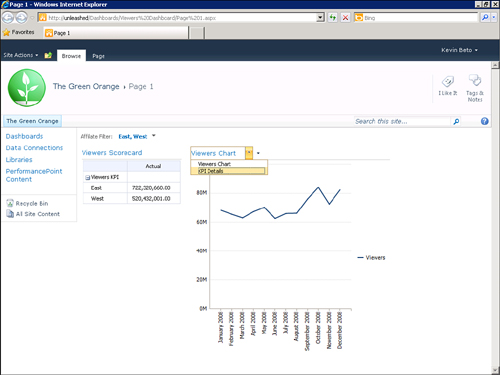
Notice that a drop-down list is added to the stacked zone. This enables users to choose which report to display in the zone.

Dashboard Pages

In some scenarios, you might not want to place all scorecards, reports, or filters on the same dashboard page. For example, there might just be too many items to fit on one page, or perhaps you want to group items based on subject. For example, you could create a Sales, HR, and IT page, all available within the same dashboard. Another example might be that you want to place all scorecards on one page and all reports on another. To do this, you can create a new page by clicking the New Page button in the dashboard’s Editor window, as shown in Figure 13. From here, you can also delete pages, change the order of pages, and name them.
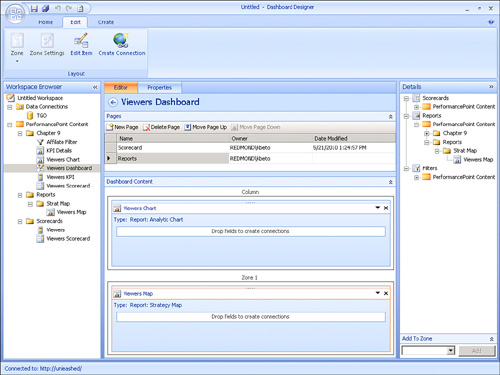
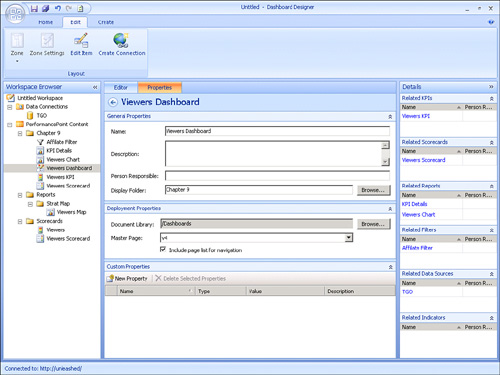
Figure 13. Use the Editor window from the dashboard to create new pages.

In Figure 14, two pages have been added: Scorecards and Reports. To add a page list navigation that enables users to choose which page within the dashboard they want to view, you need to check the Include page list for navigation option, as shown in Figure 14.
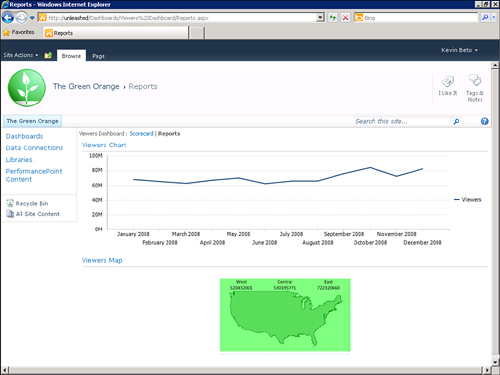
Figure 14. Be sure to check the Include page list for navigation option to enable users to choose the pages to view from the dashboard.

In Figure 15, you can see the navigation list that has been added at the top left (Viewers Dashboard: Scorecards | Reports). This allows you to switch between the Scorecards and the Reports pages.

Figure 15. This is an example of a dashboard with page list navigation.
Other -----------------
- SharePoint 2010 PerformancePoint Services : Web Part Connections
- BizTalk 2010 Recipes : Orchestrations - Configuring Basic Correlations
- BizTalk 2010 Recipes : Orchestrations - Using the Call Orchestration and Start Orchestration Shapes
- BizTalk 2010 Recipes : Orchestrations - Using the Transform Shape
- Windows Server 2003 : Deploying Security Configurations - Introducing Security Templates
- Windows Server 2003 : Deploying Security Configurations - Creating a Testing and Deployment Plan
- Windows Server 2003 : Hardening Servers - Deploying Role-Specific GPOs
- Empowering Users Through SharePoint 2010 Libraries (part 2) - A Brief Tour of a Document Library & Adding Documents to a Document Library
- Empowering Users Through SharePoint 2010 Libraries (part 1) - Using the View All Site Content Page in SharePoint 2010
- Exchange Server 2010 : Prioritizing and Scheduling Maintenance Best Practices
 
 
Top 10
- Microsoft Visio 2013 : Adding Structure to Your Diagrams - Finding containers and lists in Visio (part 2) - Wireframes,Legends
- Microsoft Visio 2013 : Adding Structure to Your Diagrams - Finding containers and lists in Visio (part 1) - Swimlanes
- Microsoft Visio 2013 : Adding Structure to Your Diagrams - Formatting and sizing lists
- Microsoft Visio 2013 : Adding Structure to Your Diagrams - Adding shapes to lists
- Microsoft Visio 2013 : Adding Structure to Your Diagrams - Sizing containers
- Microsoft Access 2010 : Control Properties and Why to Use Them (part 3) - The Other Properties of a Control
- Microsoft Access 2010 : Control Properties and Why to Use Them (part 2) - The Data Properties of a Control
- Microsoft Access 2010 : Control Properties and Why to Use Them (part 1) - The Format Properties of a Control
- Microsoft Access 2010 : Form Properties and Why Should You Use Them - Working with the Properties Window
- Microsoft Visio 2013 : Using the Organization Chart Wizard with new data
 
programming4us
Windows Vista
programming4us
Windows 7
programming4us
Windows Azure
programming4us
Windows Server