The scorecard is the display vehicle for both
indicators and KPIs. It is a highly customizable presentation vehicle
that is used to present critical business information. The scorecard is
also the only PPS Web Part that can both receive parameters from and
emit parameters to other Web Parts. This makes it a common “launch pad”
around which most dashboards are constructed.
Creating KPIs with the Scorecard Wizard
The fastest and easiest way
to create a scorecard is to create the KPIs directly from the data
source that you want to use. The wizard creates both the scorecard and a
set of associated KPIs with the scorecard. Though the wizard offers
limited formatting options, it is possible to customize the scorecard
and associated KPIs later. This means that it serves as a good tool to
get up and running quickly with scorecards.
The following example
demonstrates how to create a scorecard based on an Analysis Services
data source. It is possible to import KPIs from Analysis, too, through
the wizard. This assumes that you have KPIs stored in Analysis Services
and that you want to use them. When importing KPIs from Analysis, the
KPIs are imported using custom MDX as the KPI type. The example also
imports any custom indicators that will be utilized.
Note
A SQL Analysis Services KPI is
different from a PPS KPI. A SQL Analysis Services KPI is created using
Business Intelligence Development Studio (BIDS), which comes with SQL
Server; whereas a PPS KPI is stored in the SharePoint database.
In essence, both KPIs do the
same thing. However, the SQL Analysis Services KPI is aimed at an
information technology worker or developer, whereas the PPS KPI is aimed
toward the knowledge worker who might not have access to edit SQL
objects directly.
Tip
The overall look and
feel of the Scorecard Creation Wizard has not changed from PPS 2007 to
PPS 2010. As a result, some of the new functionality, such as calculated
KPIs, multiple actuals, and KPIs on columns cannot be created through
this wizard. If you want to use these features, it is best to create a
blank scorecard or create the KPIs you want from scratch.
1. | To start the Scorecard Creation Wizard, right-click a PerformancePoint content list, select New, and then select Scorecard.
|
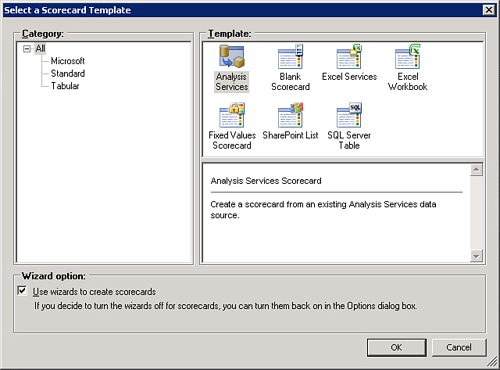
2. | Select the Analysis Services template from the Select a Scorecard Template dialog, as shown in Figure 1, and then click Next.
Note
There is an option to not use
the Scorecard Creation Wizard when creating new scorecards on this page.
Clearing this option automatically creates blank scorecards for the
current user without presenting the wizard user interface. If the check
box is accidentally cleared and you want to restore the Scorecard
Creation Wizard, go to the Designer Options menu found under the Office
jewel icon in the upper-left corner of Dashboard Designer.
|
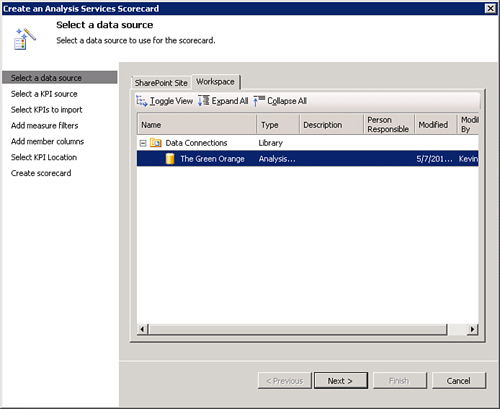
3. | Select
an available Analysis Services data source in the Create an Analysis
Services Scorecard dialog that contains KPIs to import (see Figure 2). An example of a sample data source that contains SQL KPIs is the Adventure Works Data Warehouse sample found at http://www.codeplex.com.
|
4. | Accept
the default option Create KPIs from SQL Server Analysis Services
measure from the Select a KPI Source page in the wizard, and then click
Next.
|
5. | At
this point, you see a blank list of KPIs. Click the Add button to
create an entry in the grid, which enables you to choose from the
available measures from the data source. You should also choose a
banding method.
|
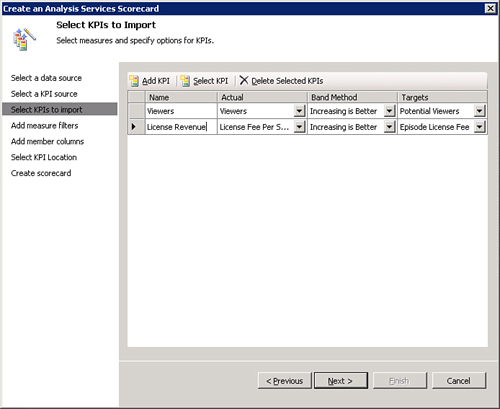
6. | Select the KPIs you want to import from the Select KPIs to Import page in the dialog shown in Figure 3, and then click Next.
Note
The Select KPI button allows inclusion of already created PPS KPIs into the scorecard you are creating.
|
7. | The Add Measure Filters dialog page, shown in Figure 4,
allows the addition of a single dimension filter to the data source. It
is not necessary to make any changes to this screen. Click Next to
continue.
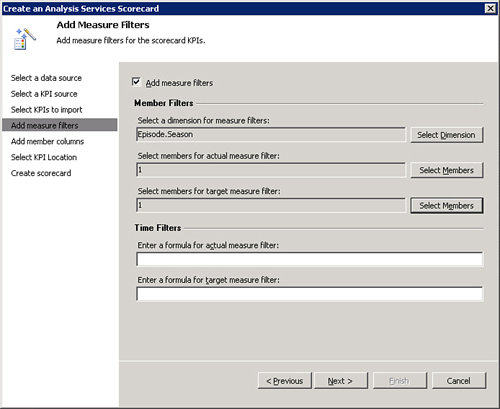
Note
Filters added in this
dialog will be placed on each KPI individually as a dimension filter. It
is also possible to place time intelligence (TI) filters on the KPIs
that are created by entering a TI formula in the Time Filters box.
|
8. | The
Add member columns page allows the addition of a dimension on the
columns of the scorecard. There is no need to make any changes on this
page. Click Next to continue.
Note
This performs the function of slicing the KPI across the dimension members selected to appear in the columns.
|
9. | The
Locations page enables you to create content in a specific PPS content
list. Select the list in which you want to create the new scorecard and
KPIs. Click Next.
|
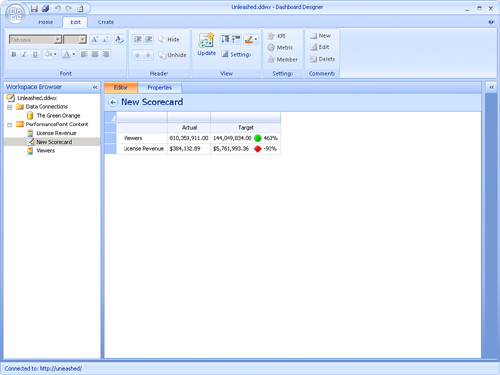
At
this point, the scorecard and all associated KPIs and indicators are
created in Dashboard Designer and the scorecard is displayed, as shown
in Figure 5. Do not forget to save the scorecard and associated KPIs to the server when you are pleased with them.