Adding a Dimension to a Scorecard
Slicing KPIs based on
dimensions from the data source is a common need for scorecards. This is
particularly useful for operational scorecards where specific details
may be required. In The Green Orange
scenario, an example of this would be to slice a Viewers KPI by each
episode. This can be accomplished by dragging and dropping dimensions
onto the scorecard. Follow these steps to do this:
1. | Locate the dimension to be added to the scorecard by expanding the Dimension node in the Details pane.
Tip
Occasionally, no dimensions are
displayed here. If you do not see dimensions, ensure that the scorecard
contains a KPI and an associated metric with a valid data source and
that the Data Sources drop-down box at the bottom of the Details pane
has the data source with the dimension you want selected.
If you are working with
multiple different data sources on a single scorecard, the Data Sources
drop-down box allows toggling between the different data sources
currently in use on the scorecard.
|
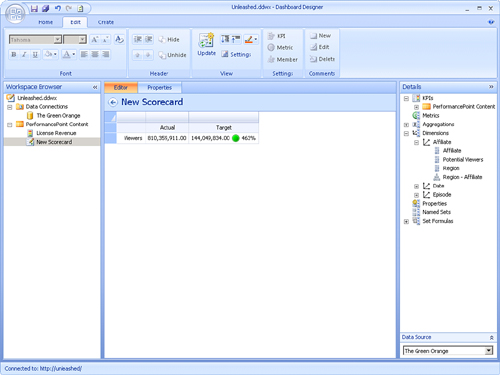
2. | Drag and drop the dimension onto the columns of the scorecard, as shown in Figure 6. The member selector appears.
Note
The UI is
somewhat nonintuitive when dragging and dropping dimensions onto
scorecards with multiple KPIs. To place a dimension underneath a single
metric or KPI, press the Shift key while dragging the dimension around
until the drop “hint” changes to show single placement.
This behavior, which is the reverse of behavior from PPS 2007, was changed in response to user feedback.
|
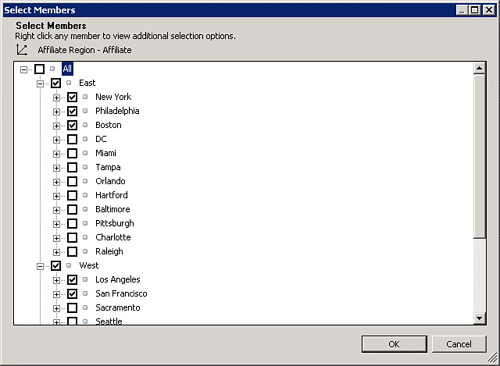
3. | Select the desired members in the member selector, as shown in Figure 7, and then click OK. The dimensions are added to the scorecard.
|
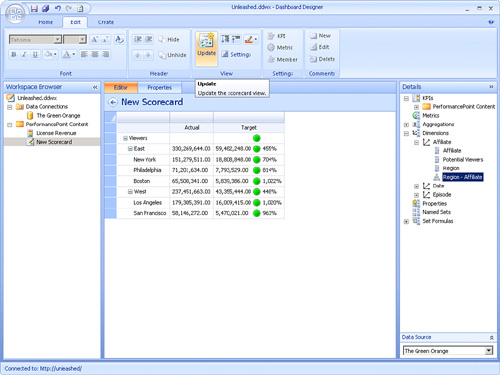
4. | Because the dimensions do not update automatically on the scorecard, click Update on the Edit tab to update the scorecard.
|
When the update is complete, a preview of the final scorecard appears on a dashboard, as shown in Figure 8.
Examining the Scorecard Editor
The
scorecard appears in the center pane in the Editor tab. You will find
all the functions you need to modify the scorecard either on the Edit
tab or by right-clicking the scorecard to bring up context menus. The
functions for editing the scorecard are identical, regardless of how you
choose to access them. It is a matter of preference.
The
Details pane on the right offers a palette to drag and drop items onto
the scorecard. Many of these items are dynamically populated based on
the current contents of the scorecard. Keep in mind that it is not
possible to drag and drop items from the Workspace Browser pane on the
left.
Updating Scorecards
Larger, more complex
scorecards may take some time to render. In addition, they may involve
several round trips to data sources, which means that automatic updating
is disabled except in rare cases. If the scorecard does not update
automatically or the data on the scorecard in Dashboard Designer is
out-of-date, click the Update button on the Edit tab to update the data.
Caution
Do not confuse the Update
button on the Edit tab with the Refresh button on the Home tab. The
Update button, which is unique to scorecards, will trigger a refresh of
the scorecard. The Refresh button does not update the scorecard.
Instead, it connects with SharePoint and updates PPS content and Data
Sources in the local copy of Dashboard Designer.
Designing Scorecards
Scorecards conceptually have two axes:
Rows (the y-axis)
Columns (the x-axis)
The scorecard editor is used by
dragging and dropping items from the Details pane on the right onto the
scorecard design surface.
Adding KPIs
To add a KPI to a scorecard,
drag and drop the KPI from the Details pane onto the scorecard in the
location you want. Only KPIs loaded in the local Dashboard Designer
cache are available for you to add. KPIs can be placed on either the
rows or the columns of a scorecard. When one KPI is placed, all other
KPIs must be placed on the same axis.
Adding Metrics
Metrics can also be dragged
and dropped onto the scorecard. Metrics must be placed on the opposite
axis from all KPIs. The list of metrics available in the Details pane is
dynamically populated from the KPIs currently placed on the scorecard.
Adding Aggregations
Aggregations on the scorecard
serve as a tool to allow the summation of all metrics. It is used by
adding the desired aggregation type above a metric column. Conceptually,
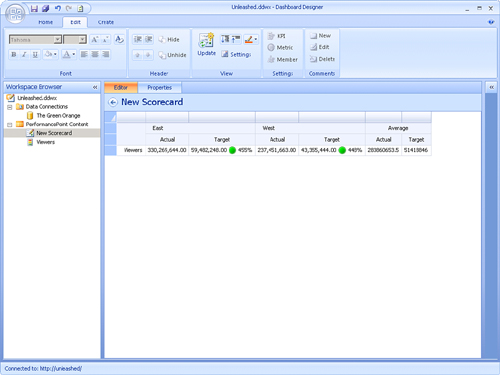
this is used as a summation column. In this Figure 9, several actual metrics are aggregated and displayed in an Average column.
There are several limitations to using aggregations on the scorecard:
Aggregations are only done over columns. It is not possible to do an aggregation on row members.
Aggregations
are done by metric name. As long as all the columns to be aggregated
have the same name, they will be aggregated together. There is no way to
include or exclude other metrics.
Trend
aggregations are calculated based on the last two columns with matching
metrics in the scorecard. If the number is decreasing, the arrow points
down. If it is increasing, the arrow points up. Currently, there is no
way to configure or tweak the trend calculation method.
Given some of these
limitations, sometimes it is better to do aggregation manually by adding
another KPI or metric to an existing KPI.
Adding Dimensions
Dimensions can be added by
dragging and dropping the dimension to the appropriate place within a
scorecard. These can be placed on rows, columns, or both if there are
two dimensions that have an intersection. In addition, dimensions can be
nested within each other.
Named Sets
Named
sets from the cube can also be placed on a scorecard. These operate
much like dimensions. However, they need to be placed in the appropriate
spot.
Set Formulas
Set formulas represent the ability to add some advanced MDX or TI expressions to the scorecard.
The Time Set Formula option allows the entry of TI expressions that will be expanded on the scorecard.
The Custom Set Formula option
allows the entry of a MDX set expression that will be used within the
scorecard. The usefulness of this feature has diminished somewhat with
the new dynamic hierarchy selection capabilities included in PPS 2010.
However, the Custom Set Formula feature does still have some value.
