Servers are the mainstay of most networks, and
keeping them running efficiently is a major part of the network
administrator’s job. You can use the Performance console and other
Windows Server 2003 tools to monitor the activities of your servers and
the applications running on them.
Monitoring Network Server Services
Network services are
applications that always run in the background, listening for and
processing client requests. In many cases, it is easy to forget that
they are even there—until something goes wrong. However, it is the job
of the network administrator to try to anticipate problems before they
become disasters, and this means regularly keeping a watchful eye on
these services. Most of the network services included with Windows
Server 2003 provide several ways to monitor their activities, including
status screens, logs, and performance counters. The procedures for
monitoring the major Windows Server 2003 network services are covered in
the following sections.
Keeping Services Running
Obviously, the most
important consideration for network services is for them to be running
when clients need them. It is common for a network administrator to find
that DNS name resolution or DHCP address assignment is failing simply
because the service is not running. There are several reasons that this
might be the case, including the following:
The service might not have started when an administrator restarted the server last.
Another administrator might have manually stopped the service for some reason, and failed to restart it.
Conditions on the server might have caused the service to stop.
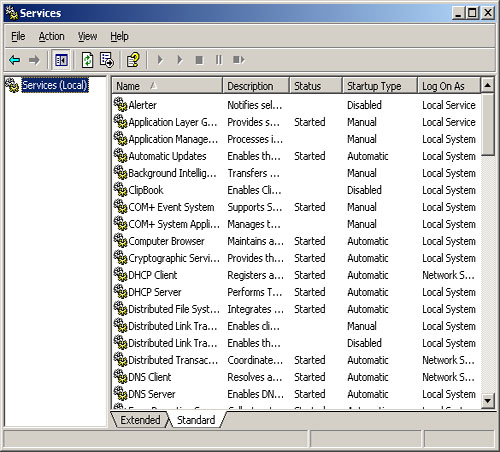
To check the
current status of the services running on a computer running Windows
Server 2003, display the Services console (see Figure 1)
from the Administrative Tools program group. For every service that you
expect to be running, Started should appear in the Status column.
In
most cases, system administrators configure the services that always
need to be running with a startup type of Automatic, so that the
services load when the operating system starts. If a service does not
start, and you have configured it for automatic startup, you should
determine why it is not running. If the service failed to start when the
system started or if it has stopped, there must be a problem, such as
insufficient system memory or some other fault. In most cases, the
System log in the Event Viewer console should contain an entry
explaining why the service stopped or failed to load. If there is no
such entry, it is possible that someone manually stopped the service,
and you should find out why before you start it again.
Monitoring DHCP
DHCP is a vital
service for the networks designed to rely on it, but a failure of the
DHCP service might not be readily apparent in some cases. By default,
DHCP servers lease IP addresses to clients for eight days at a time. If
all the computers on your network successfully obtain an address from a
DHCP server, and the DHCP server then fails, the computers can still use
their addresses until the leases expire in eight days. You might not
even know that the DHCP service is not running unless a new client
attempts to obtain an address and cannot do so.
Tip
Along
with monitoring the DHCP service for faults or errors, it is also
important to be aware of the number of addresses available in the DHCP
scopes. If all the addresses in a scope are in use, new clients
requiring address assignments cannot obtain them from that server. If
you have the addresses for a particular subnet split between two scopes
on different servers, you can modify the scope configurations to add
some addresses to the scope that is depleted. |
Viewing DHCP Server Statistics The
DHCP console includes a Server Statistics dialog box that you can
display by clicking the Server icon and then, from the Action menu,
choosing Display Statistics (see Figure 2). This dialog box contains the following information.
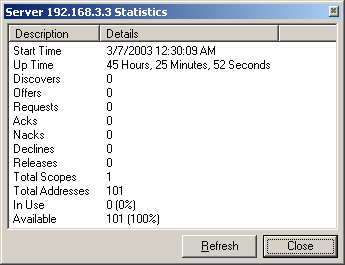
Start Time The date and time that the DHCP service was last started
Up Time The amount of time that the DHCP service has been running since it was last started
Discovers The number of DHCPDISCOVER messages that the server has received from clients, requesting IP address assignments
Offers The number of DHCPOFFER messages that the server has transmitted to clients, offering them IP address assignments
Requests
The number of DHCPREQUEST messages that the server has received from
clients, accepting offered IP addresses and renewing address leases
Acks The number of DHCPACK messages that the server has transmitted to clients, confirming IP address assignments
Nacks The number of DHCPNAK messages that the server has transmitted to clients, denying IP address assignments
Declines The number of DHCPDECLINE messages that the server has received from clients, declining offered IP addresses
Releases The number of DHCPRELEASE messages that the server has received from clients, releasing IP addresses
Total Scopes The number of operational scopes (IP address pools) on the DHCP server
Total Addresses The total number of IP addresses available in all the server’s scopes
In Use The number of IP addresses that are currently assigned by the DHCP server, in both numerical and percentage forms
Available The number of IP addresses that are currently available for allocation by the DHCP server, in both numeric and percentage form
Important
The
Available value specifies the number of IP addresses available for
allocation by all the scopes on the server combined. This means that one
or more of the scopes could still be depleted even though this value is
positive. |
DHCP Logging
Although a failure of the DHCP service to start or an incident causing
the service to shut down will usually show up as an entry in the Event
Viewer console’s System log, DHCP does not log its everyday activities
there. Instead, the DHCP service maintains its own log files in the %Systemroot%\System32\Dhcp folder on the system drive. Every entry in the DHCP log contains the following information:
See Also
Windows
Server 2003 DHCP Server uses a list of codes that represent common DHCP
activities (such as the starting and stopping of the DHCP service) and
common error conditions. The code values are accessible from the DHCP
console’s online help system. |
Date The date on which the log entry was created
Time The time at which the log entry was created
Description Describes the event that triggered the log entry
IP Address The IP address of the DHCP client (if any) involved in the event that triggered the log entry
Host Name The host name of the DHCP client (if any) involved in the event that triggered the log entry
MAC Address
The hardware address of the network interface adapter in the DHCP
client (if any) involved in the event that triggered the log entry
Using DHCP Performance Counters
Installing the DHCP Server service on a computer running Windows Server
2003 also adds the following performance counters, which you can use to
track DHCP performance in the System Monitor and Performance Logs And
Alerts snap-ins:
Acks/Sec Specifies the number of DHCPACK messages being transmitted by the DHCP server each second
Active Queue Length Specifies the number of incoming packets waiting to be processed by the DHCP server
Conflict Check Queue Length Specifies the number of outgoing conflict detection (ping) packets waiting to be transmitted by the DHCP server
Declines/Sec Specifies the number of DHCPDECLINE messages being received by the DHCP server each second
Discovers/Sec Specifies the number of DHCPDISCOVER messages being received by the DHCP server each second
Duplicates Dropped/Sec Specifies the number of duplicate packets being received by the DHCP server each second
Informs/Sec Specifies the number of DHCPINFORM messages being received by the DHCP server each second
Milliseconds Per Packet (Avg) Specifies the amount of time (in milliseconds) that the server is taking to respond to an incoming message
Nacks/Sec Specifies the number of DHCPNAK messages being transmitted by the DHCP server each second
Offers/Sec Specifies the number of DHCPOFFER messages being transmitted by the DHCP server each second
Packets Expired/Sec Specifies the number of packets in the DHCP server’s message queue that are expiring each second
Packets Received/Sec Specifies the number of packets received by the DHCP server each second
Releases/Sec Specifies the number of DHCPRELEASE messages being received by the DHCP server each second
Requests/Sec Specifies the number of DHCPREQUEST messages being received by the DHCP server each second
Monitoring these
counters is one way of determining how much network traffic the DHCP
clients and servers are generating. If the two queue length counters
frequently contain high values, you should check the server for a
bottleneck that is slowing down DHCP operations.
Monitoring DNS
A malfunctioning DNS
server can have much a more drastic and immediate effect on a network
than a DHCP server failure. Depending on the functions that the DNS
server performs, a failure could have any or all of the following
effects:
Internet clients cannot access Internet servers.
Internet users cannot access your company’s World Wide Web servers.
Internet e-mail directed to your domain bounces.
Active Directory directory service clients cannot locate a domain controller and therefore cannot log on.
Because your DNS
servers might be accessible from the Internet, they are also more
susceptible than internal services such as DHCP to attacks that can
prevent them from functioning. It is therefore important that you
monitor your DNS servers regularly.
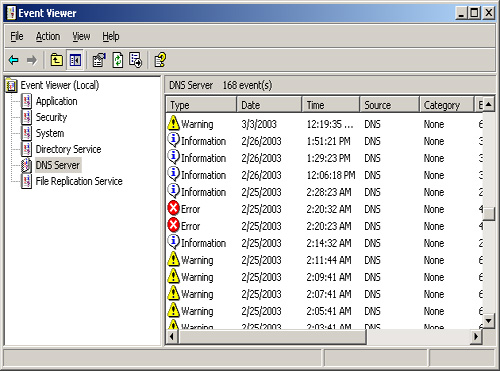
DNS Logging
Unlike most of the network services in Windows Server 2003, DNS has its own log in the Event Viewer console (see Figure 3).
This log can contain informational entries about the service’s
activities, as well as errors and warnings concerning dangerous
conditions.
Tip
You
can specify what information the DNS service saves to the Event Log by
displaying the DNS server icon’s Properties dialog box in the DNS
console, clicking the Event Logging tab, and selecting from the
following options: No Events, Errors Only, Errors And Warnings, or All
Events. |
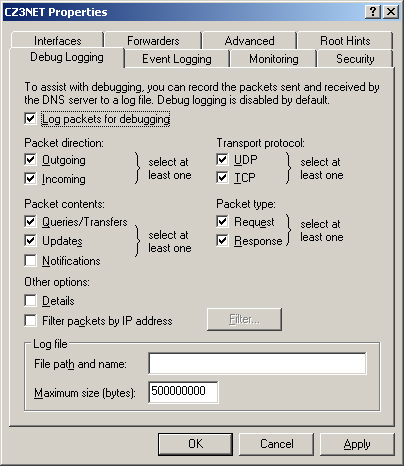
In addition to the Event
Viewer log, the Windows Server 2003 DNS Server service has debug logging
capabilities, which you configure in the Debug Logging tab in the DNS
server icon’s Properties dialog box, as shown in Figure 4.
In this dialog box, you can specify the types of messages and the
amount of detail you want to log. You can also create filters to log
only the messages to or from specific IP addresses.
By default, the DNS service saves the debugging log as a standard text file in the %Systemroot%\System32\Dns
folder on the computer’s local drive. In the Debug Logging tab, you can
also specify an alternative file name and a maximum size for the log.
Important
The
DNS service’s debug logging feature can log a great deal of detailed
information. The log file can therefore take up a lot of disk space and
consume a substantial number of processor cycles, if you let it. You
should not leave this feature on all the time. Use it only when you are
troubleshooting a problem with the DNS service or when you are
performing regular maintenance. |
Using DNS Performance Counters
A computer running Windows Server 2003 with the DNS Server service
installed also has a DNS performance object that contains over 60
performance counters to monitor virtually every DNS server activity,
using the Performance console. The DNS performance counters include
virtually every type of DNS message, incoming and outgoing. Monitoring
these counters is particularly useful when the DNS server is accessible
from the Internet. For example, using Performance Logs And Alerts to
track the number of incoming name resolution requests can help you
detect a denial-of-service (DoS) attack before it completely overwhelms
your server.
Monitoring WINS
Because it is not an
Internet service and because it is largely self-sufficient, WINS doesn’t
require a lot of monitoring. The most important element to consider in a
large WINS deployment is the database replication process. If
replication events don’t occur as planned, some of the WINS servers on
the network might not be able to resolve NetBIOS names.
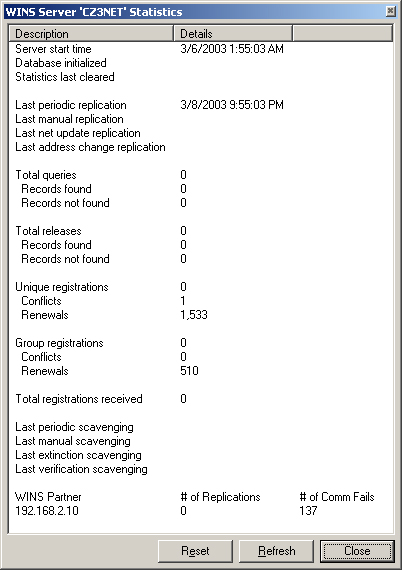
The WINS Server Statistics dialog box (see Figure 5),
which you access by clicking the Server icon in the WINS console and
selecting Display Server Statistics from the Action menu, specifies the
number of name registrations and resolutions the server has performed,
as well as information about the most recent replication processes.
The Performance
console also includes WINS performance counters that roughly correspond
to the statistics in the WINS Server Statistics dialog box, which enable
you to monitor the same statistics over time. You can also set alarms
to notify you of certain conditions, such as the number of name
resolution failures reaching a critically high amount, possible
signaling a failure in the replication process.
Monitoring Routing And Remote Access
As you have learned
throughout this book, the Routing And Remote Access service (RRAS) in
Windows Server 2003 can perform a wide variety of tasks; as a result,
there are many different status screens scattered throughout the Routing
And Remote Access console.
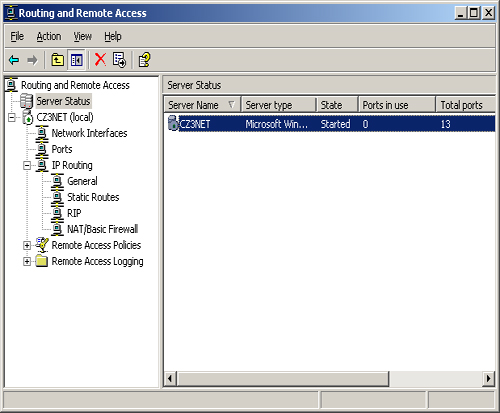
Monitoring Remote Access Activities
When you click the Server Status icon at the top of the console tree,
the details pane contains a list of all the Routing And Remote Access
servers you’ve added to the console, specifying each server’s current
operational state, the number of ports it has, and the number of ports
that are currently in use (see Figure 6).
If you have multiple RRAS servers on your network, configured to
provide remote access to clients, this is a good way to track your
current port usage at any time.
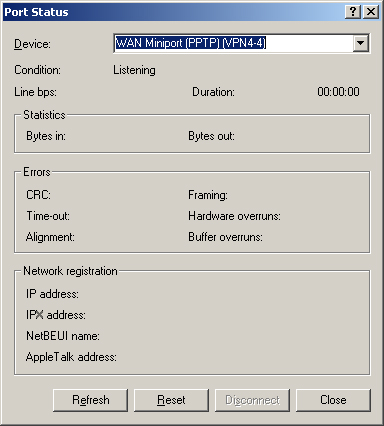
When
you click the Ports icon in the console tree, you see a list of the
server’s ports in the details pane. Double-clicking one of the ports
displays a Port Status dialog box (see Figure 7)
specifying the number of bytes the port has transmitted and received,
the number of errors that have occurred, and the IP address of the
client connected to the port.
To
monitor remote access port activities over time, you can use the Remote
Access Service (RAS) counters in the Performance console. The System
Monitor and Performance Logs And Alerts snap-ins have two performance
objects, called RAS Port and RAS Total. The RAS Port performance object
enables you to select a particular port to monitor, and RAS Total
monitors the combined activity on all ports. Individual counters in each
of these performance objects enable you to track the same statistics as
in the Port Status dialog box. Here again, you can set alerts to notify
you when errors reach a certain level, or when other possible signs of
trouble arise.
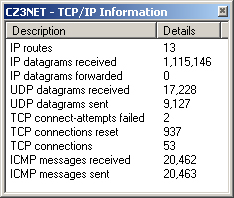
Monitoring Router Activities
When you have configured RRAS to function as a router, you can view
some basic routing statistics in the TCP/IP Information window for your
server (see Figure 8)
by clicking the IP Routing’s General subheading in the console tree
and, from the Action menu, choosing Show TCP/IP Information. This window
specifies the number of entries in the routing table and the number of
IP datagrams the router has forwarded, as well as statistics for the IP,
ICMP, TCP, and UDP protocols.
If you have installed
a dynamic routing protocol on your RRAS server, such as Routing
Information Protocol (RIP) or Open Shortest Path First (OSPF), you can
monitor it using any of the following procedures:
Select RIP, and then choose Show Neighbors from the Action menu—
Displays a list of the other RIP routers exchanging messages with RRAS,
along with the number of bad packets and bad routes attributable to
each one
Select OSPF, and then choose Show Areas from the Action menu—
Displays a list of the OSPF areas configured on the server, whether
they are operational or not, and how many link state calculations have
been performed on the interface
Select OSPF, and then choose Show Link-State Database from the Action menu— Displays the entire OSPF link state database
Select OSPF, and then choose Show Neighbors from the Action menu— Displays a list of the other OSPF routers exchanging messages with RRAS, along with information about them
Select OSPF, and then choose Show Virtual Interfaces from the Action menu— Displays a list of the OSPF virtual interfaces you have configured in RRAS
Locating System Bottlenecks
It
is not uncommon for network administrators to be faced with performance
problems that are not attributable to an obvious cause, such as a
service failure. Users might complain that their network performance is
slow at certain times of the day, or that performance has been declining
gradually over the course of weeks or months. When this occurs, one of
the most common causes is a bottleneck somewhere in the path between the
client and the data on the network that the client needs.
Note
A bottleneck
is a component that is not providing the same level of performance as
the other components in the system. For example, users might complain
that their file server performance is slow, and you might spend a great
deal of time and money upgrading your network from 10Base-T to
100Base-TX, expecting to see a dramatic improvement. However, if your
server is an old computer using a first generation Pentium processor,
the improvement is likely to be minimal, because the server’s processor,
not the LAN technology, is the bottleneck. All the other components are
running well, but the processor cannot keep up with the data flow
provided by the new, faster network. |
Locating the
bottleneck that is hindering performance can be a complicated task, but
Windows Server 2003 provides most of the tools you need. To find a
bottleneck, you usually examine the four main subsystems of a computer,
which are covered in the following sections. The Performance console in
Windows Server 2003 is usually the best tool for detecting bottlenecks,
because it includes performance counters that enable you to monitor each
of these subsystems in detail.
Tip
To
monitor these four subsystems, it is always a good idea to establish a
performance baseline first, under normal operating conditions, so that
you can compare the baseline to future statistics and discern trends
that might eventually affect performance. |
Monitoring Processor Performance
An
inadequate or improperly configured processor array can cause a server
to queue incoming client requests, preventing the server from fulfilling
them promptly. For processor monitoring, the % Processor Time counter
is the primary indicator of processor activity. If this counter
frequently reaches 100 percent, the processor is likely to be the
bottleneck. To remedy the problem, you could use faster processors, more
processors (in a multiprocessor server), or processors with larger
Level 2 caches.
Monitoring Memory Performance
An inadequate amount of
memory in a server can prevent the computer from caching frequently
used data aggressively enough, causing processes to rely on disk reads
more than memory reads, and slowing down the entire system. To monitor
memory performance, you can use counters in the Memory performance
object, such as Pages/Sec and Available MBytes. If the server gets to a
point where the amount of available memory is dwindling, you can
probably improve the performance of the entire system by installing
more.
Monitoring Storage Subsystem Performance
A
storage subsystem that is overburdened with Read and Write commands can
slow down the rate of processing client requests. The server’s hard
disk drives carry a greater physical burden than the other three
subsystems, because in satisfying the I/O requests of many clients, the
drive heads must continually move to different locations on the drive
platters. The drive head mechanism can move only so fast, however, and
once the drive reaches its maximum read/write speed, additional requests
can begin to pile up in the queue, waiting to be processed. For this
reason, the storage subsystem is a prime location for a bottleneck.
To monitor the storage
subsystem in the Performance console, you can use the counters in the
PhysicalDisk performance object, such as % Disk Time. When trying to
remedy a storage bottleneck, adding more hard drives as separate
entities generally does not do any good, unless you split your data
among the drives so that the I/O requests are divided equally among
them. Instead, you should consider adding drives and combining them in a
RAID (redundant array of independent disks) installation. With RAID,
the more disks in the array, the faster the I/O performance. If you find
that the disk time percentage is frequently at a higher level, you can
remedy the situation by adding more drives to the RAID array.
Monitoring Network Performance
The bandwidth of the
network connections limits the amount of traffic reaching the server
through its network interfaces. If counters in the Network Interface
performance object, such as Output Queue Length, indicate that the
network itself is the bottleneck, there are two remedies, and neither
one is a simple fix:
Increase the speed of the network
This means replacing the network interfaces in all the computers, hubs,
routers, and other devices on the network, and possibly replacing the
cabling as well.
Install additional network adapters in the server and redistribute the network
If traffic frequently saturates the network interfaces already in the
server, the only way to increase the network throughput without
increasing the network’s speed is to install more network interfaces.
However, connecting more interfaces to the same network will not permit
any more traffic to reach the server. Instead, you must create
additional subnets on the network and redistribute the computers among
them, so that there is less traffic on each subnet.
Tip
Be
sure to familiarize yourself with the performance counters commonly
used to locate system bottlenecks in a computer running Windows Server
2003. |
