You can use math & trigonometry functions to help
you perform mathematical calculations. You can use formulas for
calculations, such as SQRT (Square root) or TAN (Tangent); formulas for
conversion, such as DEGREES (radians to Degrees), or RADIANS (degrees to
Radians); or formulas for rounding, such as FLOOR (number down, toward
zero), CEILING (number up, towards nearest integer), INT (number down to
nearest integer), or ROUND (number to a specific number of digits). You
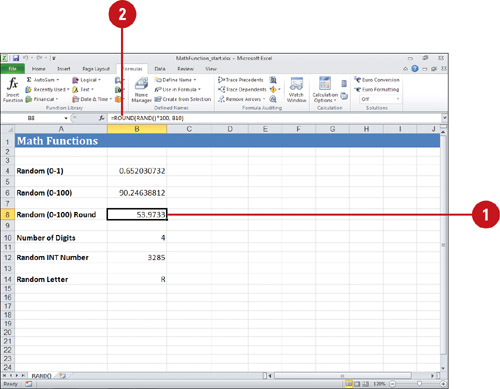
can also use the RAND function to generate random real numbers between 0
and 1, which you can use in an equation to create other random numbers,
such as =RAND()*100—creates random numbers between 0 and 100. Many of
the math functions use the following arguments: number, significance,
and angle. Significance is the multiple to which you want to round.
Use Math & Trig Functions
 Click the cell where you want to place the function. Click the cell where you want to place the function.
 Type = (equal sign), type a text function, specify the argument for the selected function, and then press Enter. Type = (equal sign), type a text function, specify the argument for the selected function, and then press Enter.
Some syntax examples include:
- =FLOOR(number, significance)
- =CEILING(number, significance)
- =INT(number)
- =INT(number, num_digits)
- =DEGREES(angle)
- =RADIANS(angle)
- =SQRT(number)
- =TAN(number)
- =RAND()
Or click the Formulas tab, click the Math & Trig button, click a function, specify the function arguments, and then click OK.
Using Statistical Functions
You can
use statistical functions to help you perform analysis on a group of
numbers. You can use formulas to find information, such as MAX or MIN
(maximum or minimum value in a list), MEDIAN (median of given numbers),
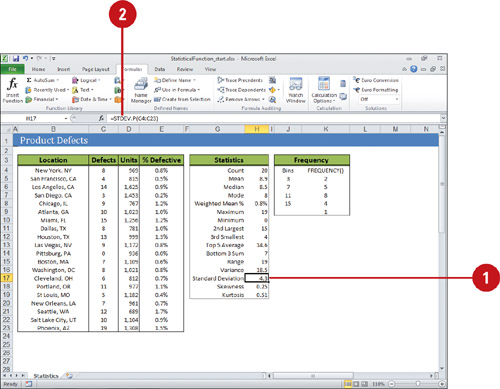
COUNT (number of items in a list), STDEV.S (standard deviation based on a
sample) (New!), STDEV.P (standard deviation based on the entire population) (New!), SKEW (skewness of the distribution), or KURT (kurtosis of a data set).
Use Statistical Functions
- Click the cell where you want to place the function.
- Type = (equal sign), type a text function, specify the argument for the selected function, and then press Enter.
Some syntax examples include:
- =MAX(number1, number2, ...)
- =MIN(number1, number2, ...)
- =MEDIAN(number1, number2, ...)
- =COUNT(value1, value2, ...)
- =STDEV.S(number1, number2, ...)
- =STDEV.P(number1, number2, ...)
- =SKEW(number1, number2, ...)
- =KURT(number1, number2, ...)
Or click the Formulas tab, click the More Functions button, point to Statistical, click a function, specify the function arguments, and then click OK.
|
