Azure Diagnostics under the hood
When we consider working with
Azure diagnostics, we need to decide what to collect and how to store
the collected data. The following table summarizes the information
available to us:
|
Data
|
Collected by default
|
Role(s)
|
Storage
|
Storage location name
|
|---|
|
Windows Azure logs
|
Yes
|
Web, Worker
|
Table
|
WadLogsTable
|
|
IIS logs
|
Yes
|
Web
|
Blob
|
wad-iis-logfiles
|
|
Windows diagnostic logs
|
Yes
|
Web, Worker
|
Table
|
WadLogsTable
|
|
Failed request logs
|
No
|
Web
|
Blob
|
wad-iis-failedreqlogfiles
|
|
Windows event logs
|
No
|
Web, Worker
|
Table
|
WadWindowsEventLogsTable
|
|
Performance counters
|
No
|
Web, Worker
|
Table
|
WadPerformanceCountersTable
|
|
Crash dumps
|
No
|
Web, Worker
|
Blob
|
wad-crash-dumps
|
|
Custom error logs
|
No
|
Web, Worker
|
Blob
|
user defined storage
|
On a traditional Windows
system, IIS logs, crash dumps and failed request logs would be stored
in files. These three logs are referred to as Directory logs in Azure's jargon, and end up in blobs. Except for custom logs, the rest of the logs are all persisted in tables.
During data collection, information is buffered in a blob, inside a container named wad-control-container. Diagnostic data are not accessible until they are transferred from wad-control-container to the proper blob or table storage. The diagnostic buffers can be manipulated via descendants of the DiagnosticDataBufferConfiguration http://nmackenzie.spaces.live.com/blog/cns!B863FF075995D18A!536.entry. class, an overview of which can be found at
There is also a much more sophisticated framework for logging and tracing, based in part on the Event Tracing for Windows (ETW) framework we may already be familiar with. Samples are available for downloading at http://code.msdn.microsoft.com/WADiagnostics. Microsoft also provides a number of additional samples in the Azure SDK and other sample downloads.
Diagnostic ETW data are available through classes in the System.Diagnostics namespace. Windows Azure Diagnostics extends this namespace with the Microsoft.WindowsAzure.Diagnostics namespace. References for the Microsoft.WindowsAzure.Diagnostics can be found at here. As a general outline, when we implement logging, the general process flow looks like the following diagram:
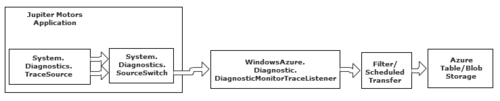
In the architecture depicted in this diagram, our application pipes diagnostic data through TraceSources, which are intermediate objects (of type used to route data to various endpoints. A SourceSwitch, where we see values such as "verbose" or "critical", determines which messages should be passed to the DiagnosticMonitorTraceListener. On a normal system, verbose data could be routed through a TraceSource with a log file endpoint, while critical errors might be routed through a TraceSource that sends a text message to a sysadmin. System.Diagnostics.TraceSource)
TraceListeners subscribe to TraceSources, and route the data to the desired endpoint. The default TraceListener in Azure is the DiagnosticMonitor,
which is a special class used to configure the collection of diagnostic
data. A diagnostic monitor can be configured to listen to a number of TraceSources. In Azure, diagnostic data are all routed to either Table or Blob Storage.
The three logs indicated as
being part of the default Diagnostic Monitor collection Azure, IIS 7,
and Windows Diagnostic are enabled by default when we use one of the
Azure templates. Because our sample is using a default template, there
is nothing much that we have to do. If we were to use our own template,
we'd have to make sure we included the initialization (refer to http://msdn.microsoft.com/en-us/library/ee843890.aspx). The other logs can be collected, but additional coding is required to activate them.
Although we may activate log
collection, that does not make the log data available to us immediately
upon collection. We also need to transfer the log data to a store we can
access, such as Table Storage. This must be done whether we're using
the default Diagnostic Monitor or we've activated an additional log
source.
The Hello Fabric
sample in the Azure SDK is a useful reference for experimenting with
diagnostic logging. It's a very simple application that can be run in
the development fabric on a development machine.
Enabling diagnostic logging
When we create an Azure
application using one of the default templates, collection of Windows
Azure, IIS, and Windows Diagnostic logs is enabled by default. We can
see the setup in the template files.
The DiagnosticMonitorTraceListener configuration for our WCF and web role projects is found in the web.config file:
<system.diagnostics>
diagnostic loggingenabling<trace>
<listeners>
<add type="Microsoft.WindowsAzure.Diagnostics.DiagnosticMonitorTraceListener, Microsoft.WindowsAzure.Diagnostics,
Version=1.0.0.0, Culture=neutral, PublicKeyToken=31bf3856ad364e35" name="AzureDiagnostics">
<filter type=""/>
</add>
</listeners>
</trace>
</system.diagnostics>
There are a number of additional configuration options in the<system.diagnostics> element; complete documentation can be found at http://msdn.microsoft.com/en-us/library/1txedc80.aspx. Specifically, the<filter> element (http://msdn.microsoft.com/en-us/library/ms229326.aspx) is used to set the SourceSwitch filtering values.
The DiagnosticMonitorTraceListener is started in our projects' OnStart method, found in the webrole.vb file:
Public Overrides Function OnStart() As Boolean
DiagnosticMonitor.Start("DiagnosticsConnectionString")
...
End Function
In our workerrole.vb file, we have the following entry in the Run method that logs the start of the role.
Public Overrides Sub Run()
Trace.WriteLine("JupiterMotorsWorkerRole entry point called.", "Information")
...
End Sub
Enabling the additional logging types is easy, but not all the logs are
implemented in the same way. For instance, the Failed Request Logs are
enabled by editing the web.config file, whereas the Windows Event Logs are enabled with some code in the Role.OnStart method. The MSDN documentation for enabling other sources of diagnostic information can be found at http://msdn.microsoft.com/en-us/library/ee843890.aspx.
One of the more interesting and useful sources of diagnostic information
is performance counters. We've all probably used performance counters
in the past when debugging all sorts of issues, and Azure provides us
with the same capabilities. The downside to performance counters is that
we configure them in the Role.OnStart()
method, so we must redeploy our application if we want to change them.
One possibility would be to preconfigure a number of performance
counters, wrapped in if...then blocks
that check for values in the config files. This way, we can turn
collection of performance counters on and off by editing the proper
config file. The following is the configuration for the % Processor Time
counter. Note that there is a very specific format used for the CounterSpecifier.
Public Overrides Function OnStart() As Boolean
Dim diagConfig As DiagnosticMonitorConfiguration = DiagnosticMonitor.GetDefaultInitialConfiguration()
Dim procTimeConfig As PerformanceCounterConfiguration = New PerformanceCounterConfiguration()
procTimeConfig.CounterSpecifier = "\Processor(*)\% Processor Time"
procTimeConfig.SampleRate = System.TimeSpan.FromSeconds(1.0)
diagConfig.PerformanceCounters.DataSources.Add(procTimeConfig)
DiagnosticMonitor.Start("DiagnosticsConnectionString")
Return MyBase.OnStart()
End Function
Diagnostic
configuration is not global configuration applies only to the role where
we have added the code. We need to be sure to configure data collection
for each and every role we want to be able to debug (which is pretty
much every role). If we're interested in the same information, it's just
copy-and-paste code, but we still need to remember to do it.
Changing the location of the logging configuration
In an ASP.NET application, the usual place to configure SourceSwitches and other configuration details is in the web.config file. This way, if we need to change the level of diagnostic information collected, we can simply edit the web.config and commence debugging. By default, the diagnostic configuration information for an Azure application is stored in the web.config
file. However, Azure applications are not deployed in the same way as
ASP.NET applications. Azure applications are compiled into a single file
and deployed as a single file. We cannot simply edit a web.config (or an app.config in the case of a worker role) once an Azure application is deployed. If we need to edit the web.config or app.config, we would need to edit the files locally and redeploy the entire application post-edit.
With Azure applications, the recommendation is to duplicate configuration settings into both the web.config and the .cscfg file. The .cscfg file can be changed while the application is running, but the web.config
cannot be changed in the application. This setup requires a little
extra effort at the beginning, but the effort can be worth it when
needed. The idea behind duplicating the configuration is that an
application can be deployed on Azure, and then later redeployed on
premises without any additional modification. If this application is
sure to not be deployed on IIS, the web.config edit can be skipped.
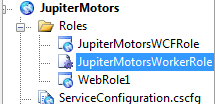
The easiest way to add the required settings to the .cscfg file is to open the Roles subfolder, right-click the role we want to modify, and choose Properties.
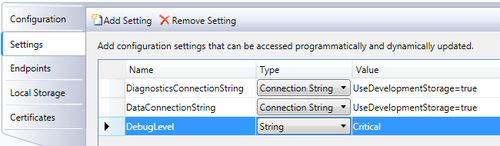
In the Properties panel, select the Settings tab, click the Add Setting button, and add a String setting. This setting will act as our SourceSwitch and help us determine the level of information we want to capture.
Adding a setting via the Properties panel makes an entry in both the .cscfg and the .csdef files. The .csdef file must contain a definition for every setting in the .cscfg
file, and cannot be edited in a live application. Therefore, we cannot
add additional settings to a live application, but we can change their
values.
The final step is to add a few
lines of code to help our application determine if it's running on IIS
or Azure. We simply need to check for RoleEnvironment.IsAvailable, which is available only in Azure.
Dim _debugLevel As String
If RoleEnvironment.IsAvailable Then
' gets the value from .cscfg file
_debugLevel = RoleEnvironment.GetConfigurationSettingValue( "DebugLevel")
Else
' gets the value from web.config file
_debugLevel = WebConfigurationManager.AppSettings("DebugLevel")
End If
The template projects include configuration settings for DiagnosticsConnectionString and DataConnectionString.
By default, these connections point to a local SQL Server Express
instance on our development machines, and obviously the connection
strings need to be updated when we deploy our application. Again, if we
weren't using a default template, we'd need to add these configuration
settings too.
There are two useful
resources about working with diagnostic logging and configuration files
in Azure one is an MSDN article titled Take Control of Logging and Tracing in Windows Azure (http://msdn.microsoft.com/en-us/magazine/ff714589.aspx), and a code project article titled Windows Azure Development Deep Dive: Working With Configuration (http://www.codeproject.com/KB/azure/azure-configuration.aspx), on which part of the MSDN article is based.
