1. Problem
You need to create a solution
that will track your company's business processes, compile the data into
key performance indicators (KPIs), and develop a portal to display the
information to executives. You have already created and deployed
activities and views from a BAM worksheet to define and track the key
performance indicators, and you would now like to consume that data from
a portal.
2. Solution
Once you have developed
and deployed BAM activities to track your KPIs, you may now consume the
data from an ASP.NET portal without writing any code. You can accomplish
this by utilizing out-of-the-box BizTalk reporting capabilities through
the BAM portal. The BAM portal is a web-based portal built from ASP.NET
that allows you to view and query cubed data created within the BAM
framework. This recipe will cover three primary activities within the
BAM portal:
NOTE
Installing the BAM Portal
on 64-bit machines requires that IIS allow for 32-bit applications.
This can be easily accomplished by running the following command line
script: cscript %SYSTEMDRIVE%\inetpub\adminscripts\adsutil.vbs SET W3SVC/AppPools/Enable32bitAppOnWin64 0.
2.1. Accessing the BAM Portal
Take the following steps to access the BAM portal:
Deploy BAM activities and views.
Open the portal by navigating to Start => All Programs => Microsoft BizTalk Server 2010 => BAM Portal Web Site.
Once
you have opened the portal, you will notice three primary panes: the
header frame at the top, the view frame to the left, and the content
frame to the right. If you have deployed activities and views, they will
be available under the MyViews tree.
2.2. Performing an Activity Search
BAM activities capture
business processes milestones and business data at a specific point in
time. An activity search allows you to define, save, open, and execute
queries to retrieve that transactional business data. The activity
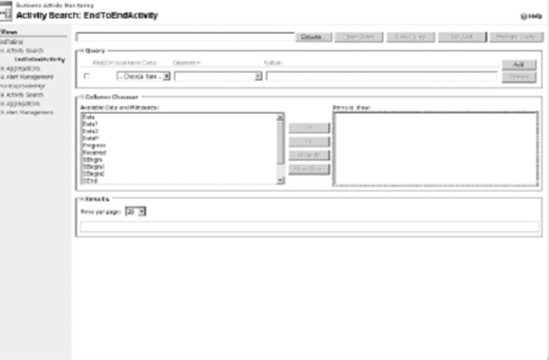
search page has three main sections, as shown in Table 1.
Table 1. Sections of Activity Search Page
| Page Section | Description |
|---|
| Query | This
section of the page allows you to define, save, and open queries.
Queries let you constrain which activities to return in the results
window. |
| Column Chooser | This section of the page defines which columns to return in the result set. |
| Results | The section of the page displays the result set retuned by executing the query against the BAM activity data. |
To perform an activity search, take the following actions:
Under the My Views tree, expand the view that correlates to the view name you have deployed.
Expand
the Activity Search node, and click a deployed activity. This action
will open a query window like the window displayed in Figure 1.

Within the Query pane, build a query by configuring one or more constraints. To configure a constraint, follow these steps:
Choose a field from the Business Data drop-down list.
Choose an operator from the Operator drop-down list.
Enter a value in the Value text box.
Click the Add button to insert additional constraints.
NOTE
You cannot create
complex constraint logic, such as nested constraints. The portal will
allow you to add constraints only with simple and/or relationships. By
adding more than one constraint, an additional drop-down list will
appear that will allow you to define the constraint relationship.
Within the Column Chooser pane, choose one or more columns to display in the Results pane.
Click Execute Query. The Results pane will display the query results.
2.3. Viewing Aggregations
Activity searches provide transactional business data from a specific point in time, and aggregations
provide aggregated business data about a group of processes at a
specific point in time. This aggregated data is processed and stored in
OLAP cubes and accessed through pivot tables. The Aggregations page has
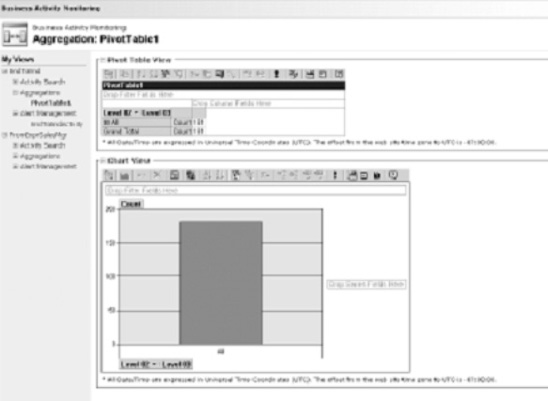
two main sections, shown in Table 2.
Table 2. Sections of the Aggregations Page
| Page Section | Description |
|---|
| Pivot Table View | Pivot
tables provide for a way to summarize and work with data separate from
the core spreadsheet. This section contains a standard pivot table. The
table automatically points to the BAM framework and specifically the
activities and views you have deployed. |
| Chart View | This
section contains the chart view that displays, in chart form, the data
filtering configured in the pivot table. It is also possible to change
the chart view to any chart available through the office framework. |
To view an aggregation, take the following actions in the BAM portal:
Under the My Views tree, expand the view that correlates to the deployed view name.
Expand the Aggregations node, and click a deployed pivot table. This action will open a window like the one displayed in Figure 2.

NOTE
If the BAM portal
displays the "Safety settings on this machine prohibit accessing a data
source on another domain" error in the pivot table, you need to change
your security settings for Internet Explorer. Open the security settings
by selecting the Tools =>
Internet Options menu in Internet Explorer. Select the Security tab,
and then click the Custom button. Once you are prompted with the
Security Settings dialog box, locate the Miscellaneous heading, and
select the Enable option for the Access Data Sources Across Domains
choice. Finally, you will receive an error if no data exists in the
cube.
From
the pivot table View toolbar, click the Field Chooser icon. This will
display a list of fields available with your BAM view.
Drag one or more total or detail fields to the center of the pivot table.
Next, drag one or more column fields to the column section of the pivot table.
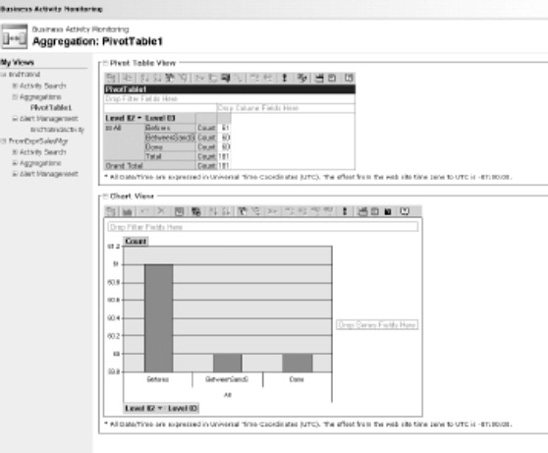
Close the Pivot Table Field List control. Figure 3 shows what the pivot table with data should look like.

NOTE
The pivot table is a
powerful tool, and this recipe does not go into the many features it
provides. You should spend some time researching what this tool can
provide and how to use it to its full potential.
3. How It Works
The BAM portal is a feature
in BizTalk 2010 that facilitates the rapid consumption of business
transactional and aggregated data, without writing any code. The portal
is self-configuring, fairly easy to set up, and provides rich data
retrieval capabilities. This recipe has provided a high-level
understanding of what you can do with the portal, but it has an
additional powerful feature, BAM alerts. BAM alerts allow you to
configure and receive alerts related to specific changes in business
data.
The BAM portal provides several areas of configuration: the look and feel of the main or dashboard page, the web.config
file, a network load balancing (NLB) clustering. By default, the main
dashboard, or Getting Started page, displays navigation instructions to
the user. The content for the main dashboard page is located in the MainPageContent.htm file, which is located in the root of the BAM portal web site folder and can be altered.
Another area of configuration is web.config. This configuration file is similar to standard web.config files and allows you to configure security as well as environment settings for the BAM portal. The web.config
setting highlights include referencing the BAM web services that may be
hosted on different machines in a distributed environment, referencing a
different main dashboard page file, culture support, and service
timeout configuration. Additionally, the types of alert notifications
are customizable in web.config.
Finally, BAM fully
supports high availability through clustering and can be scaled like
other web applications through NLB. Please refer to the help file for
specific instructions about how to change these settings.