Using
OpsMgr is relatively straightforward. The OpsMgr monitoring environment
can be accessed through three sets of consoles: an Operations Console, a
Web console, and a command shell. The Operations Console provides full
monitoring of agent systems and administration of the OpsMgr
environment, whereas the Web console provides access only to the
monitoring functionality. The command shell provides command-line access
to administer the OpsMgr environment.
Managing and Monitoring with OpsMgr
As mentioned in the
preceding section, two methods are provided to configure and view OpsMgr
settings. The first approach is through the Operations Console and the
second is through the command shell.
Within the Administration
section of the Operations Console, you can easily configure the security
roles, notifications, and configuration settings. Within the Monitoring
section of the Operations Console, you can easily monitor a quick
“up/down” status, active and closed alerts, and confirm overall
environment health.
In addition, a web-based
monitoring console can be run on any system that supports Microsoft
Internet Explorer 6.0 or higher. This console can be used to view the
health of systems, view and respond to alerts, view events, view
performance graphs, run tasks, and manage Maintenance mode of monitored
objects. New to OpsMgr 2007 R2 is the ability to display the Health
Explorer in the Web console.
Reporting from OpsMgr
OpsMgr
management packs commonly include a variety of preconfigured reports to
show information about the operating system or the specific application
they were designed to work with. These reports are run in SQL Reporting
Services. The reports provide an effective view of systems and services
on the network over a custom period, such as weekly, monthly, or
quarterly. They can also help you monitor your networks based on
performance data, which can include critical pattern analysis, trend
analysis, capacity planning, and security auditing. Reports also provide
availability statistics for distributed applications, servers, and
specific components within a server.
Availability reports are
particularly useful for executives, managers, and application owners.
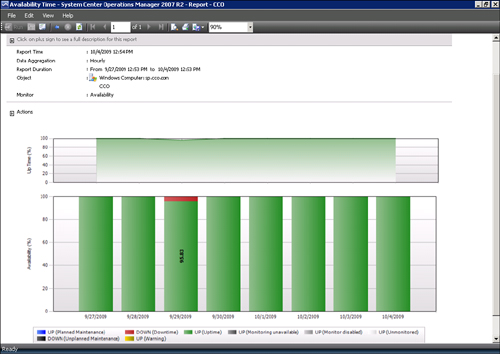
These reports can show the availability of any object within OpsMgr,
including a server (shown in Figure 1),
a database, or even a service such as Windows Server 2008 R2 that
includes a multitude of servers and components. The Availability report
shown in Figure 1
indicates that the SP server was down on 9/29/2009 for about 4.17% of
the time or just slightly over 1 hour. The rest of the time it had been
up.

The reports can be run on demand
or at scheduled times and delivered via email. OpsMgr can also generate
HTML-based reports that can be published to a web server and viewed
from any web browser. Vendors can also create additional reports as part
of their management packs.
Using Performance Monitoring
Another
key feature of OpsMgr is the capability to monitor and track server
performance. OpsMgr can be configured to monitor key performance
thresholds through rules that are set to collect predefined performance
data, such as memory and CPU usage over time. Rules can be configured to
trigger alerts and actions when specified performance thresholds have
been met or exceeded, allowing network administrators to act on
potential performance issues. Performance data can be viewed from the
OpsMgr Operations Console.
In addition, performance
monitors can establish baselines for the environment and then alert the
administrator when the counter subsequently falls outside the defined
baseline envelope.
Using Active Directory Integration
Active Directory integration
provides a way to install management agents on systems without
environmental-specific settings. When the agent starts, the correct
environmental settings, such as the primary and failover management
servers, are stored in Active Directory. The configuration of Active
Directory integration provides advanced search and filter capabilities
to fine-tune the dynamic assignment of systems.
Integrating OpsMgr Non-Windows Devices
Network management is not a new
concept. Simple management of various network nodes has been handled for
quite some time through the use of the SNMP. Quite often, simple or
even complex systems that utilize SNMP to provide for system monitoring
are in place in an organization to provide for varying degrees of system
management on a network.
OpsMgr can be configured
to integrate with non-Windows systems through monitoring of syslog
information, log file data, and SNMP traps. OpsMgr can also monitor TCP
port communication and website transaction sequencing for
information-specific data management.
New to OpsMgr 2007 R2 is
the ability to monitor non-Microsoft operating systems such as Linux and
UNIX, as well as the applications that run on them such as Apache and
MySQL. OpsMgr monitors the file systems, network interfaces, daemons,
configurations, and performance metrics. Operations Manager 2007 R2
supports monitoring of the following operating systems:
HP-UX 11i v2 and v3 (PA-RISC and IA64)
Sun Solaris 8 and 9 (SPARC) and Solaris 10 (SPARC and x86)
Red Hat Enterprise Linux 4 (x86/x64) and 5 (x86/x64) Server
Novell SUSE Linux Enterprise Server 9 (x86) and 10 SP1 (x86/x64)
IBM AIX v5.3 and v6.1
These operating systems are
“first-class citizens” in Microsoft’s parlance, meaning they are treated
as equals with the Windows operating systems. Agents can be pushed from
the console, operations data is collected automatically, tasks can run against the agents, and all major functions are supported.
Special connectors can be
created to provide bidirectional information flows to other management
products. OpsMgr can monitor SNMP traps from SNMP-supported devices as
well as generate SNMP traps to be delivered to third-party network
management infrastructures.
Exploring Third-Party Management Packs
Software and hardware
developers can subsequently create their own management packs to extend
OpsMgr’s management capabilities. These management packs extend OpsMgr’s
management capabilities beyond Microsoft-specific applications. Each
management pack is designed to contain a set of rules and product
knowledge required to support its respective products. Currently,
management packs have been developed for APC, Cisco, Citrix, Dell, F5,
HP, IBM, Linux, Oracle, Solaris, UNIX, and VMware to name a few. A
complete list of management packs can be found at the following
Microsoft site: http://technet.microsoft.com/en-us/opsmgr/cc539535.aspx.