Logo
programming4us
programming4us
programming4us
programming4us
Home
programming4us
XP
programming4us
Windows Vista
programming4us
Windows 7
programming4us
Windows Azure
programming4us
Windows Server
programming4us
Windows Phone
 
Windows Server

Microsoft Dynamics GP 2010 : Visualizing information with Home page Metrics

- Free product key for windows 10
- Free Product Key for Microsoft office 365
- Malwarebytes Premium 3.7.1 Serial Keys (LifeTime) 2019
7/7/2011 11:27:56 AM
On the Home page Dynamics GP provides a default set of metrics via charts and graphs designed to provide better visualization of data based on a user's role. Individual users can include or exclude various charts from their Home page and select a default chart. In this recipe, we'll look at ways to tailor the Home page metrics for each user.

How to do it...

Home page metrics provide charts for additional analysis. Let's see how to put these to use by completing the following steps:

  1. 1. On the Home page in the Metrics section move the mouse over the title Metrics to expose additional options on the right. Click on the pencil icon that now appears on the title bar to the right.

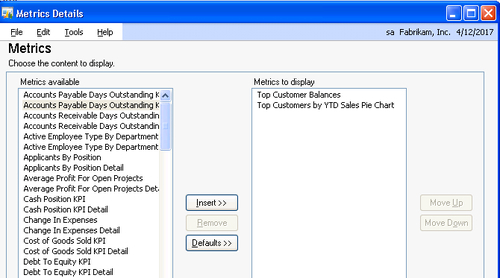
  2. 2. The left-hand side shows all of the metrics available to a particular user. Selecting a metric on the left and clicking on Insert moves that metric to the right and makes it available on the user's Home page. Selecting a chart on the right and clicking on Remove eliminates that chart from the Home page:
How it works...

The Metric functionality was significantly expanded in version 2010. In Dynamics GP 2010, users can add multiple metrics to their Home page. Additionally, users can create their own metrics using SQL Server Reporting Services (SSRS) and apply those metrics to their Home page.

There's more...

Dynamics GP 2010 provides an option to view multiple metrics on the Home screen, open metrics in a browser window, and drill back for more information.

Multiple metrics

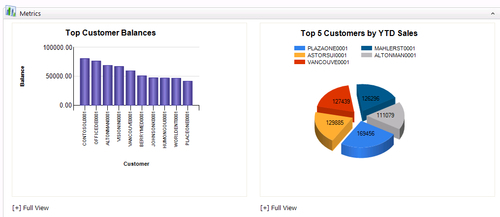
Inserting multiple metrics in the Metrics to display box will place all of those metrics on the Home page:
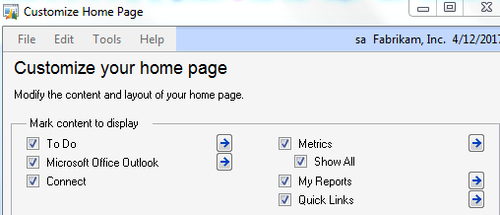
The option to display all of the selected metrics is controlled by the Customize this Page selection on the Home page. Once opened, the Show All checkbox under the Metrics selection of the Customize Home Page window controls how many metrics are shown on the Home page. If the Show All checkbox is selected, all of the metrics will appear. If it is not selected, one metric will show on the Home page with an option to scroll through all of the available metrics:
Full View

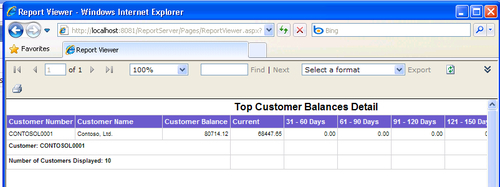
Clicking on the Full View option below a metric opens the SSRS report behind that metric in a web browser. Selecting individual items in the metric drills back to reports with more information. For example, clicking on Full View below the Top Customer Balances metric and then clicking on the CONTOSOL0001 column drills down into that customer's balance detail:
Other -----------------
- SQL Server 2008 Reporting Services : Developing Expressions - Using Aggregate Functions (part 2) - Using an Aggregate Function in a Data Region
- Microsoft Dynamics AX 2009 : Enterprise Portal and Web Parts & Reporting Framework
- Microsoft Dynamics AX 2009 : Application Model Layering System & Application Frameworks
- Microsoft Dynamics AX 2009 : Application Development and Runtime Configurations & Architecture of Dynamics AX
- Microsoft PowerPoint 2010 : Expanding PowerPoint Functionality - Inserting ActiveX Controls & Using ActiveX Controls
- Microsoft PowerPoint 2010 : Saving a Presentation with Macros & Opening a Presentation with Macros
- SQL Server 2008 : Managing Backups - Backup Types
- SQL Server 2008 : Managing Backups - Recovery Models & Backup Architecture
- Microsoft Dynamics CRM 2011 : Closing an Opportunity & Reopening an Opportunity
- Microsoft Dynamics CRM 2011 : Using Opportunities to Forecast Potential Sales
 
 
Top 10
- Microsoft Visio 2013 : Adding Structure to Your Diagrams - Finding containers and lists in Visio (part 2) - Wireframes,Legends
- Microsoft Visio 2013 : Adding Structure to Your Diagrams - Finding containers and lists in Visio (part 1) - Swimlanes
- Microsoft Visio 2013 : Adding Structure to Your Diagrams - Formatting and sizing lists
- Microsoft Visio 2013 : Adding Structure to Your Diagrams - Adding shapes to lists
- Microsoft Visio 2013 : Adding Structure to Your Diagrams - Sizing containers
- Microsoft Access 2010 : Control Properties and Why to Use Them (part 3) - The Other Properties of a Control
- Microsoft Access 2010 : Control Properties and Why to Use Them (part 2) - The Data Properties of a Control
- Microsoft Access 2010 : Control Properties and Why to Use Them (part 1) - The Format Properties of a Control
- Microsoft Access 2010 : Form Properties and Why Should You Use Them - Working with the Properties Window
- Microsoft Visio 2013 : Using the Organization Chart Wizard with new data
 
programming4us
Windows Vista
programming4us
Windows 7
programming4us
Windows Azure
programming4us
Windows Server