Using an Aggregate Function in a Data Region
The main difference between using an aggregate function in a freestanding text box and using one in a data region is the Scope argument. Whereas this argument is required in a freestanding text box, you can omit the Scope argument in a data region if Reporting Services can infer the scope correctly. An exception to this rule is the RunningValue
function, which not only requires you to specify scope but also
requires you to specify an aggregate function to use to accumulate
values.
To better understand how you might use the RunningValue
function, consider a request from a business user to facilitate
comparisons of product mixes across reseller business types. More
specifically, the business user wants to see which products contribute
most to sales for each reseller business type. To support this analysis,
your report must show the products grouped by reseller business type.
You must calculate the cumulative sales for each product within the
group and the cumulative percentage of total sales for the group. When
the products are sorted in descending order, the user can see easily
which products collectively contribute to a target percentage of sales,
such as the top 20 percent of sales or the top 50 percent of sales.
In this procedure, you use the RunningValue function to compute the cumulative sales and percentage of cumulative sales by product for each business type.
Use the
RunningValue
function in a tablix
1. | Click
the Design tab, click the tablix, right-click the Sales Amount column
handle, select Insert Column, and select Right to add a new column.
| 2. | In the new column, in the detail row (to the right of [SalesAmount]), right-click the text box, and select Expression.
| 3. | In the Set Expression For: Value box, create the following expression:
=RunningValue(Fields!SalesAmount.Value, Sum, "BusinessType")
Important Be careful to match the case exactly when specifying the Scope argument in an aggregate function. Note that you must enclose the scope name in double quotes. When using the RunningValue function, be sure to include the aggregate function without quotes. |
| 4. | Click OK to close the Expression dialog box.
| 5. | In the Properties window, in the Name text box, type CumulativeSales.
| 6. | In the header text box above the new expression, click twice to insert the cursor inside the text box, and then type Cumulative Sales.
| 7. | Click the column handle of the new column, and then, in the Properties window, in the Format text box, type C0.
| 8. | Right-click the Cumulative Sales column handle, select Insert Column, and select Right to add a new column.
| 9. | In the new column, in the detail row (to the right of <<Expr>>), right-click the text box, and select Expression.
| 10. | In the Expression dialog box, create the following expression:
=ReportItems!CumulativeSales.Value/ReportItems!BusinessTypeTotal.Value
This expression computes the percentage of sales for the cumulative sales value of the current record.
| 11. | Click OK to close the Expression dialog box.
| 12. | In the header text box above the new expression, click twice to insert the cursor inside the text box, and type Cumulative Sales Pct.
| 13. | Click the Cumulative Sales Pct column handle, and then, in the Properties window, in the Format text box, type P0.
| 14. | Save and then preview the report.
| 15. | Click
the Next Page button on the Preview toolbar to view the second page and
confirm the cumulative sales value resets to 0 when the next business
type instance begins, as shown here.
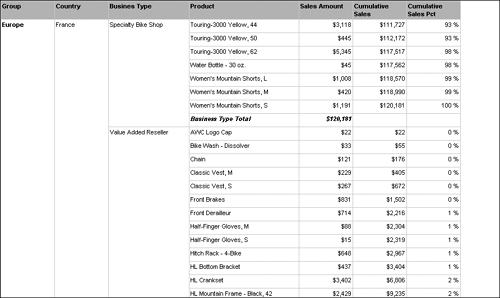
Currently, because the product data is
not sorted, products are listed in the order that the records are
returned from the database. When working with cumulative sales data, you
can sort the data in descending order by sales amount to easily see
which set of products represent a particular percentage of sales.
| 16. | Click the Design tab, and then, in the Row Groups pane, right-click (Details), and click Group Properties.
| 17. | In the Group Properties dialog box, click Sorting.
| 18. | Click Add, and then, in the Sort By drop-down list, select [SalesAmount].
Notice the Expression button to the right of the Sort By
drop-down list. Instead of sorting by a field in the dataset, you can
define an expression to sort data.
| 19. | In the Order drop-down list, select Z To A to sort in descending order, and click OK.
| 20. | Save and then preview the report, as shown here.
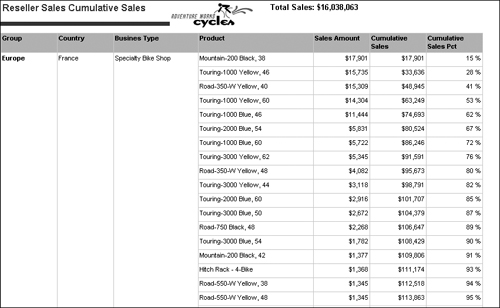
In
the report, you can now see that in specialty bike shops in France,
four products represent more than 50 percent of all sales. |
|
