Practice: Configuring Diagnostic Levels and the Monitoring And Status Utility
You can control the events
that are recorded in the application log of Event Viewer by changing the
diagnostic logging level and by specifying events using the Monitoring
And Status utility.
Exercise 1: Configure Diagnostic Logging
In this exercise, you
check Event Viewer to determine whether any Exchange errors exist. You
then change the diagnostic logging level and inspect the more detailed
information that results from this configuration change. To view the
application log and configure diagnostic logging, perform the following
steps:
1. | On Server01, from the Start menu, point to Administrative Tools, and then click Event Viewer.
| 2. | In Event Viewer, in the console tree, click Application.
| 3. | In the details pane, browse through the events, paying particular attention to any red stop events and yellow warning events.
| 4. | Minimize the Event Viewer window.
| 5. | Start Exchange System Manager.
| 6. | Navigate to Administrative Groups\First Administrative Group\Servers. Right-click Server01, and then click Properties.
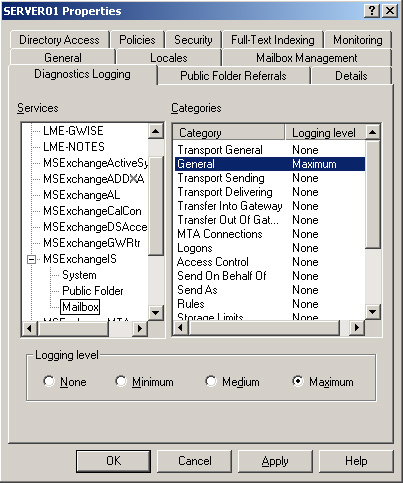
| 7. | Select the Diagnostics Logging tab.
| 8. | On the Diagnostics Logging tab, under Services, expand MSExchangeIS, and then click Mailbox.
| 9. | Under Category, click General.
| 10. | In the Logging Level box, select Maximum, as shown in Figure 4, and then click OK.
| 11. | Expand the Event Viewer window (or open Event Viewer if you closed it earlier).
| 12. | On
the View menu in Event Viewer, click Filter. This lets you filter the
log and list entries for a specific type of Exchange-related event.
| 13. | In the Application Properties dialog box, in the Event Source drop-down list, click MSExchangeIs Mailbox Store, as shown in Figure 5.
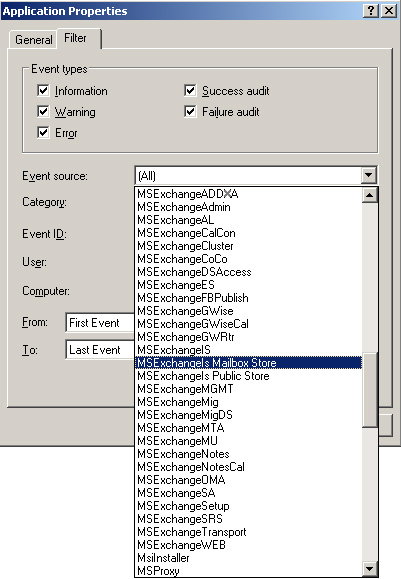
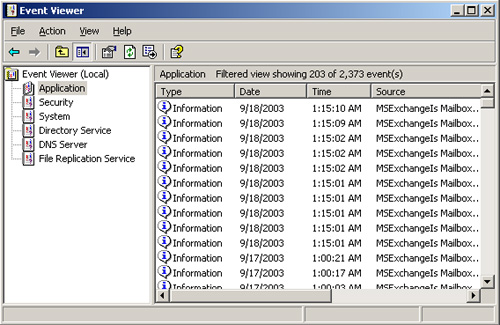
| 14. | In
the Application Properties dialog box, in the Category drop-down list,
click General, and then click OK. You should see a list of events
similar to those shown in Figure 6.
| 15. | On the View menu, click All Records to view all events, and then close Event Viewer.
| 16. | In Exchange System Manager, right-click Server01, and then click Properties.
| 17. | Select the Diagnostics Logging tab.
| 18. | Under Services, expand MSExchangeIS, and then click Mailbox.
| 19. | Under Categories, click General.
| 20. | In the Logging Level drop-down list, select None, and then click OK.
|
Exercise 2: Specify Events to Monitor
In this exercise,
you use the Monitoring And Status utility in Exchange System Manager to
configure monitoring levels for key services and resources on an
Exchange Server 2003 server.
Start Exchange System Manager. Expand Tools, expand Monitoring And Status, and then click Status. Check
the details pane to determine whether Server01 or any of the listed
connectors have a status of Unreachable, Unknown, Critical, Warning, or
Unavailable. Click Add on the Monitoring tab. Note You
can access the same control by navigating to Administrative
Groups/First Administrative Group/Server/Server01, right-clicking
Server01, clicking Properties, and then selecting the Monitoring tab. |
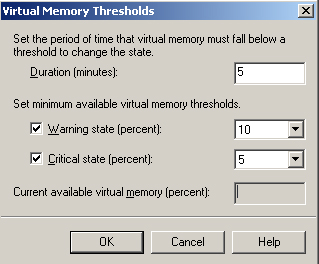
In the Add Resource box, click Available Virtual Memory, and then click OK. Specify virtual memory thresholds, as shown in Figure 7, and then click OK.
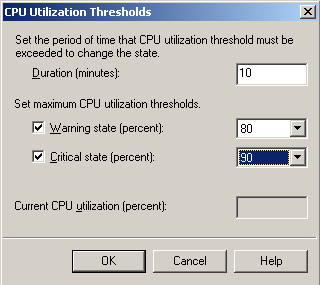
Click Add on the Monitoring tab. In the Add Resource box, click CPU Utilization, and then click OK. Specify CPU utilization thresholds, as shown in Figure 8, and then click OK.
Repeat
the same procedure to specify free disk space thresholds. If you have
more than one disk volume, you can repeat the procedure for each of
them. Specify SMTP queues growth and X.400 growth thresholds. Click Add, then click Windows 2000 Service, and then click OK. Off the Record Currently, this says “Windows 2000 Service” rather than “Windows 2003 Service.” |
In
the Services dialog box, in the pull-down menu next to When Service Is
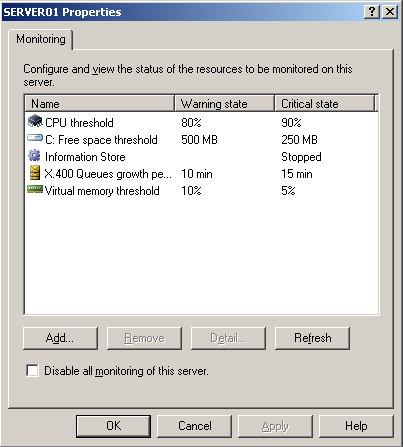
Not Running Change State To, select Critical, and then click Add. Select Microsoft Exchange Information Store, and then click OK. In the Name box, in the Services dialog box, type Information Store, and then click OK. Your Server01 Properties dialog box should look similar to Figure 9. When the limits that you specified are exceeded, events will be written to the application log in Event Viewer.
Click OK to close the Properties dialog box.
|
