Event Viewer
Event Viewer is a
Windows utility that you can use to monitor hardware and software
activities. Exchange Server 2003 uses the application log in Event
Viewer to record errors, warnings, and information events. You can
review the data in the application log to identify problems that have
occurred and to anticipate problems before they occur. For example, a
corrupt database will log errors in Event Viewer during online
maintenance and online backups. By monitoring Event Viewer, you can
identify a corrupt database and repair it before the symptoms of the
fault impinge on your users.
You need to
distinguish between Event Viewer entries that indicate normal behavior
for the Exchange Server 2003 server and events that indicate a problem.
By reviewing the event logs daily, you can establish a baseline of
typical events that will save you time in identifying the events that
need your attention.
Normal Events
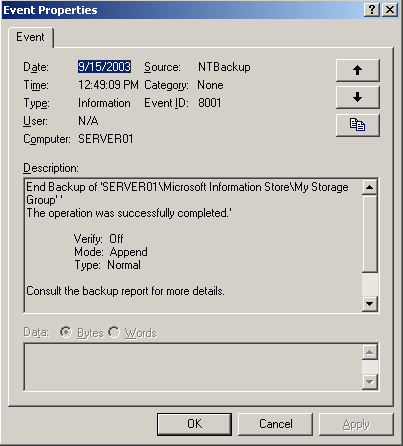
Table 1 lists some of the events you might see during normal operation. Such events are logged as information events. Figure 13-2 shows an Event Viewer event report.
Table 1. Normal Exchange Server 2003 Events
| Event number | Indication |
|---|
| 700 and 701 | Online defragmentation is beginning or has completed a full pass. |
| 1206 and 1207 | Starting cleanup of items past retention date for item recovery, or cleanup is complete. |
| 1221 | The database “....” has x megabytes of free space after online defragmentation has terminated. |
| 9531 and 9535 | Starting cleanup of deleted mailboxes that are past the retention date, or cleanup is complete. |
Abnormal Events
Table 1
lists some of the events you might see if Exchange Server 2003 is
experiencing problems. Such events are logged as warning or error
events.
Table 1. Exchange Server 2003 Error or Warning Events
| Event number | Indication |
|---|
| 2064 and 2069 | Directory service access problems caused by incorrect DNS configuration. |
| 9582 | Virtual memory is low or fragmented. |
| 1018, 1018, and 1022 | Joint Engine Technology (JET) error events that indicate possible file-level damage to an Exchange database. |
You can select an event
source in Event Viewer to monitor events related to specific functions.
You should monitor the following on a regular basis:
MSExchangeTransport
Select this event source to view events recorded when SMTP is used to
route messages. Event ID 4000 indicates that a connection has failed for
a reason other than a specific protocol error. DNS problems, the server
not being online, and connections that are dropped when the server is
overloaded or hits internal errors can also cause connection failures.
MSExchangeAL
Select this event source to view events related to the service that
addresses e-mail through address lists. Event ID 8026 indicates problems
with network connectivity or Lightweight Directory Access Protocol
(LDAP) configuration.
MSExchangeIS
Select this event source to view events related to the service that
allows access to mailbox and public folder stores. Event ID 9518
indicates a failure while starting an Exchange storage group—for
example, if all databases in a storage group are offline or if an
Extensible Service Engine (ESE) error occurred while starting a database
within a storage group.
MSExchangeSA
Select this event source to view events that are recorded when Exchange
uses Active Directory to store and share directory information.
If you identify
potential problems with your Exchange Server 2003 server during your
daily monitoring, you can control the amount of information logged in
the application log by increasing the logging level. The higher you set
the logging level, the more events you can view in the application log.
This can help you diagnose the problem.
You can open the
application log in Event Viewer, access Event Source, and select an
Exchange-related event source. You can configure diagnostic logging to
set Event Viewer’s logging level. This is done in Exchange System
Manager rather than in Event Viewer itself. On the Diagnostics Logging
tab of the Server Properties dialog box, you can configure the logging
level for each service and category for which you want to configure
diagnostic logging. Be aware that if you increase the logging levels for
Exchange services, you may experience some performance degradation.
Tip
If
you increase the logging levels on your Exchange server, also increase
the size of the application log to contain all the data produced.
Otherwise, you will receive frequent reminders that the application log
is full. |
The Monitoring And Status Utility
The
Monitoring And Status utility provided as part of Exchange System
Manager monitors key Exchange Server 2003 services by default. In
addition, you can configure the utility to constantly monitor the
performance level of other network and application services. You should
use the Monitoring And Status utility daily to monitor the status of
your servers and connectors and to determine if they are functioning
properly.
You can use the Status
column in Monitoring And Status to determine whether any service
failures exist, whether system resources are running low, or whether
messages are not flowing. Table 2 describes what each server status level indicates.
Table 2. Server Status Levels
| Server status | What it indicates |
|---|
| Unreachable | One
of the main services on the server is down or, if a server is in a
different routing group, a connector between routing groups may be down
or may not exist. |
| Unknown | System Attendant cannot communicate with the local server. |
| Critical or Warning | A monitored resource has reached the critical or warning state defined for that resource. |
| Unavailable | A communication service, such as the routing service, is not functioning on this connector. |
Queue Viewer
You can use the Queue
Viewer utility in Exchange System Manager to maintain and administer
messaging queues in your Exchange organization. In Queue Viewer, the
following queues can be displayed from either a local or a remote
computer:
An SMTP virtual server queue
A Microsoft message transfer agent (MTA) object queue
A connector queue
DNS messages pending submission
A failed message retry queue
Messages queued for deferred delivery
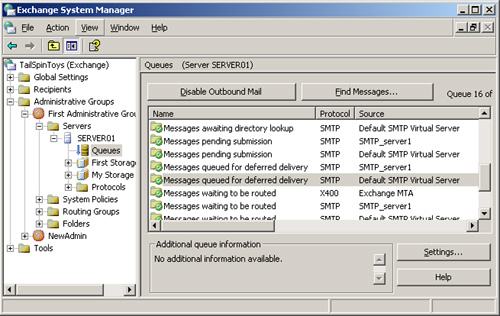
As shown in Figure 3,
the Queue Viewer utility provides the Disable Outbound Mail, Settings,
and Find Messages options. There is also a pane (blank in the figure)
for displaying additional queue information. You can monitor queues on a
daily basis, and the utility is also used to identify problems that
require on-demand maintenance.
Disable Outbound Mail
You
can use the Disable Outbound Mail option to disable outbound mail on
all SMTP queues. You may need to do this if, for example, a virus is
active in your organization. The option does not disable the MTA or
System queues.
If you want to
prevent outbound mail from transmitting from a particular remote queue,
then you can freeze the messages in that queue instead of disabling all
SMTP queues. To do this, right-click the queue and then click Freeze.
Right-click the queue and then click Unfreeze to unfreeze the messages.
Settings
You can use the
Settings option to determine the frequency with which the queues are
refreshed. The default refresh rate is once every two minutes. You can
set the refresh rate to once every minute, every five minutes, every 10
minutes, or to Never Refresh. If you are trying to resolve a delivery
problem, you may want to set the refresh interval to a small value, such
as one minute, so that you can see changes to the queues sooner.
Find Messages
You can use the Find
Messages option to display messages in the queue or to search for
messages by specifying search criteria, such as the sender or recipient
and the message state. You could, for example, search for all frozen
messages. You can also specify the number of messages that you want your
search to return. You can use this option if you are searching for a
particular message or if you want to list the messages in the queues to
see when the oldest message was submitted.
Additional Queue Information
You
can use the Additional Queue Information option to view troubleshooting
information about a particular queue. It also displays information
about errors returned from Exchange-specific extensions to the SMTP
service and indicates when a queue is unavailable—for example, when a
service is not started.
Using Queue Viewer to Find Potential Problems
Exchange Server 2003
uses queues to hold messages while they are being processed for routing
and delivery. If messages remain in a queue for an extended period, a
problem may exist, such as an Exchange server not being able to connect
to the network. It is therefore your responsibility as an Exchange Full
Administrator to monitor Exchange queues daily.
You should first list
messages in a queue by selecting the queue and by using the Find
Messages feature. You can use Queue Viewer to determine if a problem
exists with that queue. You can then review the State column in your
search results to see which state the queue is in. Table 3 lists the message states.
Table 3. Message States in Queue Viewer
| Message State | Description |
|---|
| Active | Indicates that a link queue has an active connection. No action is required. |
| Ready | Indicates that a link queue is ready to have a connection allocated to it. No action is required. |
| Retry | Indicates
that a connection attempt has failed and that the server is waiting for
a retry. You should review the State column again after a short period
of time to ensure that this state has changed. If the message is still
in the Retry state, then you need to identify the problem that is
preventing the queue from delivering messages. |
| Scheduled | Indicates that the queue is waiting for a scheduled connection attempt. No action is required. |
| Remote | Indicates that the queue is waiting for a remote dequeue command. No action is required. |
| Frozen | Indicates
that no messages can leave the link queue. Messages can be inserted in
the queue if the Exchange routing categorizer is still running. If you
have frozen the queue for a particular reason, such as during a virus
attack, you need to unfreeze the queue when the virus problem is
resolved. |
You
then need to review the Number Of Messages and Total Message Size (KB)
columns to see if a large number of messages are backed up in the queue
or if the message size of any message is too large for your Exchange
organization. If a large number of messages are backed up in the queue,
you can force a connection by right-clicking the queue and clicking
Force Connection. If you have an extremely large message that is
preventing other messages from being delivered, you should consider
deleting the message.
You can also use the
Find Messages feature to locate a specific message in the message
queues. Typically, you look for a message in a queue if a user reports
that he or she sent an important message that was not received. In this
case, you can use the Search Results pane to view information about the
messages located in the queue, such as whether the message is in the
Retry state, what the size of the message is, what time the message was
submitted, and at what time the message will expire. This information
will help you to identify potential or current problems.
