A KPI details report enables you to click a key
performance indicator (KPI) in a scorecard and display detailed
properties about the KPI. This proves useful for conserving space on the
screen while including available detailed information on indicators
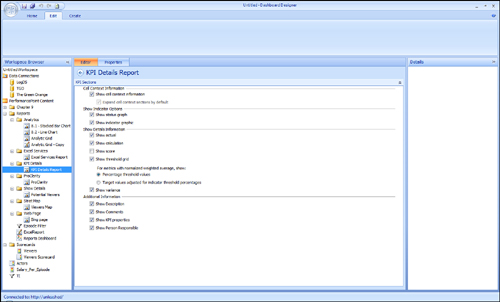
without displaying or printing this information for every single KPI. Figure 1 shows the available KPI properties for the KPI details report.

Show Cell Context Information is a
KPI report that is available out of the box (OOTB). This type of KPI
report shows information such as measures, filters, column, and row path
information. For example, if a KPI has a filter applied to it, the
report will indicate the active filter selections. You can use the PPS
SDK to create additional types of KPI reports.
Note
There is an additional
option available from the Show Cell Context Information called Expand
Cell Context Sections by Default, as well as options for Show Status
Graph and Show Indicator Graphic. These additional options are not yet
fully implemented features. Look for this functionality to be completed
at some point in the future.
Show Details Information:
Includes some additional numeric properties that might be of value to a
scorecard viewer. They are only applicable when the metric selected is a
Target metric and are especially useful when incomplete information is
shown in the final scorecard such as when no actual column is displayed
for space constraints.
Show Actual: Shows the value of the actual metric against which this target metric is being compared.
Show Calculation: Shows the scoring pattern used for this target metric.
Show Score: The final calculated score for this target metric.
Show Threshold Grid:
A small chart showing all available indicator bands. It also shows
where the thresholds are for this particular target metric. This grid is
especially useful to help answer a question such as, “How close are we
to green?”
Show Variance: Shows the variance of the actual value from the target value.
Listed here are the Additional Information values, which are text values that can be displayed when the KPI is selected (see Figure 8.24).
Show Description: This value comes directly from the Description text field in the Properties tab for the KPI.
Show Comments: Shows a list of comments added to that cell in the KPI details report.
Show KPI Properties: A series of values that come directly from the Custom Properties collection in the Properties tab for the KPI.
Show Person Responsible: This value comes directly from the Person Responsible text field in the Properties tab for the KPI.
After you have specified
the properties you want to display, you need to add the KPI report to a
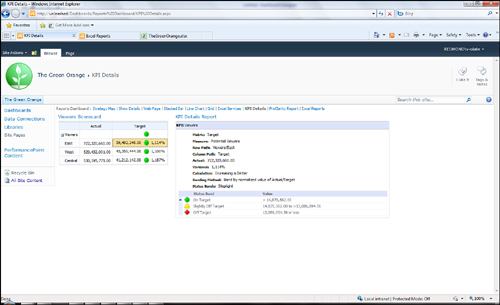
dashboard and create a connection from a scorecard KPI. In Figure 2,
you see a scorecard in the left Zone 1 and a KPI details report in the
right Zone 2. To create the connection, drag and drop the Cell - Context
endpoint from the scorecard to the Drop fields to create the
connections area on the KPI details report.

After the dashboard has been deployed, you can click any of the scorecard KPIs and see the details displayed in the KPI report.