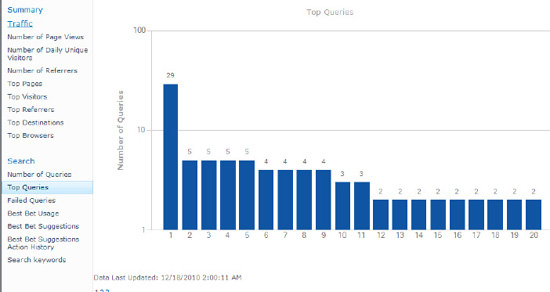
4. Top Queries
The Top Queries report will show up to the top 50 search queries (Figure 6).
This will represent the terms that are of the largest interest in the
organization. You can see the terms for each query, the number of times
each query was searched for, and the percentage in relation to all
search queries.
This report gives a good idea of
the most common interests in an organization. There are always some
surprises in this report for administrators. What users expect to find
and what is actually in a site can often be different. Administrators,
working with department heads, can help users to align their interests
and knowledge information needs with publishing and documentation
practices. Sometimes investigating this information can also open up
areas of business or collaboration for companies. For example, if all
the engineers are looking for policy documents that HR is responsible
for but are not included in the Engineering department's site
collection, users can be directed to the correct site or search can be
expanded to include broader scopes.
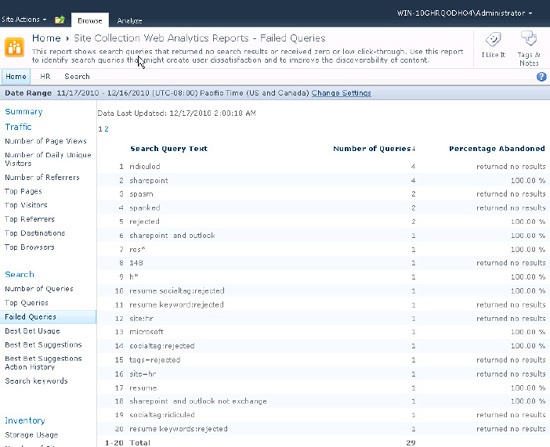
5. Failed Queries
Perhaps the most important of the reports is the Failed Queries report (Figure 7). Microsoft groups both no-result
queries and no-click queries into the same Failed Queries report. The
queries are ranked based on the number of queries and itemized by the
percentage of abandonment—that is, those queries where no search result
link was clicked. This is important to identify because if people are
searching and not actioning the results, they have not technically had a
successful search. There are some instances where there is an exception
to this, and users may find the information they want within the result
set. Search-based applications and search centers with added
functionality can make the search results page a valuable information
delivery tool in itself. However, for standard SharePoint search, no
click can almost always be equated with no success. Therefore, terms
with a high rate of abandonment should be taken seriously.
The action points for this
report are clear but not always straightforward. The administrator
should identify why these terms were search for and why they did not
either return a result or receive a click. The case of no result should
be followed with an inquiry into what the users are expecting and then
providing it. This could mean adding content, adding synonyms in the
thesaurus file, or adding tags to existing documents. In the case of low
click-through, the searches should be performed and the result list
investigated to see why the results were not attractive enough. This
could be a matter of poor titles or descriptions, insufficient metadata
displayed in the results, or poor ranking. Improving document quality
and adding metadata (properties) is a good way forward. Best bets can
also be added to give the specific user the best document for the search
term at the top of the results page, regardless of the organic result
list.
6. Best Bet Usage
The Best Bet Usage
report will independently report the number of click-throughs that each
best bet that is defined gets. This will show if best bets are being
utilized over organic search results. If the terms are added to best
bets in reaction to data in the Top Queries or Failed Queries reports,
benchmarking for the success of modifications using best bets can be
tracked. If best bets are not being used, try to change the wording to
entice the users to click the best bets as opposed to the organic
results or re-evaluate the goal of the searches.
7. Best Bet Suggestions
The Best Bet
Suggestions report offers suggested best bets based on the data in the
other reports. The suggested best bets can be added as easily as
clicking Accept or Reject in the report. This is an easy modification
for site collection administrators that can improve search with very
little effort. However, it requires that the administrator is aware of
the reports and visits them regularly.
8. Best Bet Suggestions Action History
The Best Bet Suggestions Action History is simply a log of previous best bets suggestions that have been accepted or rejected.
9. Enabling Reporting
In SharePoint 2010,
the Usage and Health Data Collection service applicationand the Web
Analytics service, are installed by default. The Usage and Health Data
Collection Service Application is the service that collects the search
usage data. The Web Analytics service is the service that then analyzes
and makes that data available. Both are necessary to get search
reporting.
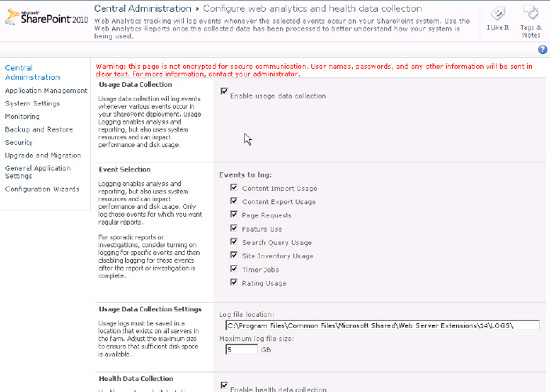
If the search reports do not
contain any data, it is possible data collection has been disabled at
the Usage and Health Data Collection service application. This is often
done for storage and performance issues. This service application can be
found in Central Administration under Manage Service Applications,
Usage and Health Data Collection. Make sure Search Query Usage is
checked. See Figure 8.
10. Displaying Report Data in Site
Another useful way to
utilize search results to affect search behavior is to post a list of
the most frequently queried search terms. There are advantages and
disadvantages to this technique. The advantages are that other users can
learn from the previous search queries and find information in a way
they didn't think of themselves. However, by allowing them to click the
top search terms and fire a search off, they force those search terms to
remain in the top search terms as they will remain the most popular
simply because they are there to click. Regardless, it can be an
informative and interesting piece of information to display and a useful
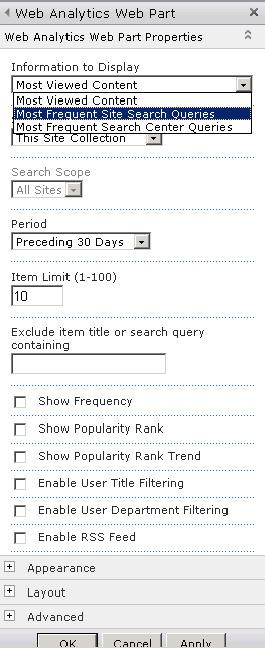
alternative means to access search. To enable display of the top search
term on a site or page, edit the page and add the Web Analytics Web
Part by clicking the Insert tab on the ribbon and choosing Insert Web
Part. When the Web Part dialog appears, choose Content Rollup Web Parts
and the Web Analytics Web Part. Add it to the page where you want the
top search queries displayed. After the Web Part is on the page, you
should choose edit Web Part from the drop-down on the top of the Web
Part. Then under Information to Display, choose Most Frequent Site
Search Queries. See Figure 9.