When it comes to improving usability in SharePoint
2010, reporting is certainly an essential tool. This is especially true
for search in SharePoint. Many administrators consider search a "black
box" that, when functional, will operate on its own and produce results
in some mysterious and wonderful manner. The truth is that search
engines are just computer programs that follow a set of rules. Many of
these rules we have already seen in the previous section and found to be
insufficient at returning the best content for each and every query.
Therefore SharePoint 2010
has some great built-in reporting technology to allow search and farm
administrators to monitor overall performance as well as allowing site
collection administrators to monitor individual site search success and
make modifications to the search behavior as well as the content based
on those reports.
Reporting is a key feature
in SharePoint 2010 that allows administrators to see statistical
information on the behavior of the users and their interaction with the
search engine. The reporting mechanism can identify key query terms that
are causing frustration for users as well as areas of search that are
not working optimally. There are two levels of reporting to
administrators in SharePoint, the farm level and the site collection
level. These levels are set to allow administrators with different
levels of focus in the organization to get the reports that are useful
for their particular job function. Farm administrators, who are
responsible for the management of the SharePoint farm and its core
functionality, can see reports that will help them maintain a working
search engine and improve crawling and index quality. The site
collection administrator can see reports for his or her site collection
and all its sites and subsites. These reports help the site collection
administrator optimize the search experience for his or her end users on
their own level.
1. Farm Level Reports
General search reporting can
be found in the Search service application in Central Administration and
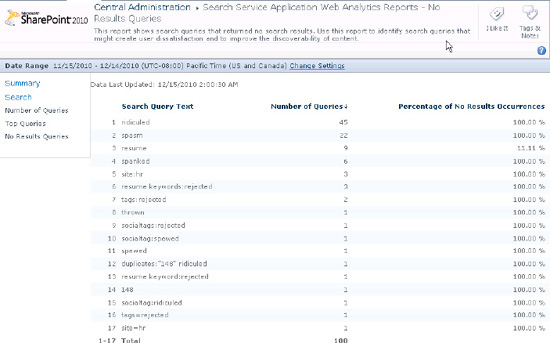
includes Top Queries and No Result queries. The point of this reporting
is to help search or farm administrators learn about the general
success and performance of the search engine. Content can be targeted
for crawling, crawling errors can be addressed, authoritative pages set,
and unwanted results removed based on information from these reports.
This farm-level reporting
can help us identify these overall search performance issues and
potentially make adjustments to the search engine at the search service
to compensate for problems. To access the farm-level search reporting in
SharePoint 2010, follow these steps:
Open Central Administration on your SharePoint farm.
Click Manage Service Applications.
Navigate to the Search service application.
On
the left menu under Reports, there are two types of reports,
Administrative Reports and Web Analytics Reports. Choose Web Analytics
Reports.
In the base report, we can
see the total number of search queries and the average number of search
queries per day. This can help the administrator manage load and monitor
search for performance. If this number is very high, the administrator
should consider adding a query server after investigating the
administrative reports.
If this number is unusually low, the administrator should investigate
why users are not searching and confirm that the search mechanism is
working for all users. Sometimes poor site setting can restrict access
to search or cause other problems that make search non-functional for
end users, and they won't even complain.
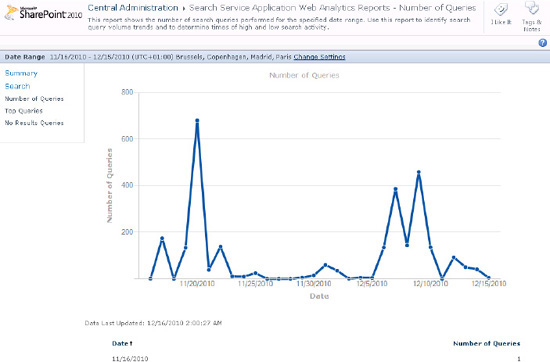
On the top of the left-hand navigation, we can navigate to the Number of Queries report (Figure 1). This will give a more detailed view of the number of queries over time in a graph (Figure 2) and the exact numbers for each date (Figure 3).
NOTE
The farm-level search
reporting shows the search usage statistics for the entire farm. This is
important for farm administrators to get an overall view of the search
trends and performance of the farm. For more detailed results, site
collection reports can be seen at each site collection. However, these
reports will cover data only for the individual site collection.
2. Site Collection Reports
At the site collection level,
there is more detailed reporting that will help the site collection
administrators to identify areas where content and metadata can be
improved to help search as well as add or improve best bets. Site
collection reports show the data only for the individual site
collection. An organization with many site collections will need to
analyze the reports at different collections.
To understand the value of
the reports, it is useful to understand the behaviors of search users.
The basic mechanism of searching in SharePoint is similar to all search
engines. A user enters a query into a search box, either on a search
page or on a search field on any page in a SharePoint site. This query
of one or many terms is passed to the search engine, and a list of
matching hits is displayed in an order the search engine determines best
for the given query. At this point, a user looks through the list and
does one of a few things. The user can click a document to open it and
move on, add terms to the query and search again, refine the result set
with refiners, or just leave the search experience and navigate away.
From the search engine's perspective, this creates four basic search behaviors:
Success: A successful
search is a search where the user enters a query, gets a result set,
looks through the results, clicks a result link, and gets the document
that he or she is looking for.
Partial success:
A partial success is where a user enters a query, gets a result set,
looks through the results, and clicks a link but gets the wrong
document. He or she then goes back and clicks another or searches again.
Unsuccessful with results:
This behavior sees a query entered, and a result set displayed, but no
action taken on the results. The user clicks nothing and either searches
again or leaves the search experience.
No results: The user searches but gets a blank search page and a message suggesting search hints.
Although it seems strange, the "no
results" behavior is extremely common for enterprise search engines.
This is largely due to misspellings, synonym usage, or misconceptions by
the end users. When a user searches for something he or she is certain
exists or should exist in the organization—a key piece to achieving the
information task at hand—and gets nothing, he or she can become
extremely frustrated. This makes the "no results" search experience the
most acute problem and the one of utmost urgency when optimizing the
search engine.
The following reports are available under the Search section in the Site Collection Web Analytics Reports pages:
Each one of these report
pages displays a different view of the search behaviour of the end
users. These reports can help the administrator identify and correct for
the failed search behaviour as well as give guidance on how to improve
search with built in suggestions. The following sections will cover the
important reports and how to best utilize them but first will outline
the basic features of all report pages. In the Analyze tab of the ribbon
on the report pages, the reports can be adjusted for timespan, filters
can be applied, and the reports customized or exported for sharing or
further analysis (Figure 4). Furthermore, alerts and reports can be scheduled for those that are too busy to remember to look at the reports regularly.
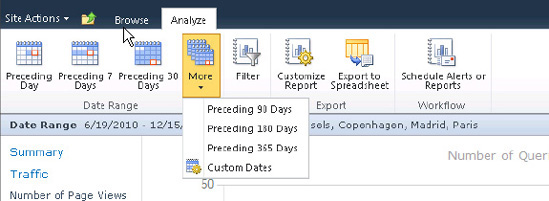
There are some preset
timespans available like week, month, or year. In addition, a custom
timespan can be set. This data can be exported, and one timespan can be
compared to another to perform benchmarking against changes or
improvements made to search. The filtering mechanism for search reports
allows for filtering based on pre-defined search scopes—that is, any
scopes that are already created and used in the search interface. And
Customize Reports allows for downloading the report to an Excel sheet to
manipulate the reporting parameters. The Excel sheet maintains a data
connection to the SharePoint site and will update the data as it
changes. Excel makes it easy for administrators to generate custom
graphs and work with the report data (Figure 5).
3. Number of Queries
The Number of Queries
report shows the aggregate amount of queries at that site collection and
the number of queries per day. It shows trends in search activity from
end users. Normally, search should peak mid-week and taper off toward
the weekend, depending on what kind of organization is using SharePoint
and what the key motivators for information discovery are. This data can
help predict load for the site, identify problems with the search
engine, or the level of user adoption. If many users are proving
frustrated by SharePoint or not fulfilling their information management
tasks, a low number of queries could identify a need for training or
adoption programs.
