What’s New in OpsMgr R2
System Center
Operations Manager 2007 R2 was released in Spring 2009, and includes
many new improvements on the previous version, Operations Manager 2007
Service Pack 1. Some of these improvements include:
Cross Platform Support—
This is support for non-Microsoft platforms such as UNIX and Linux.
This enables administrators to have a single-pane view of their entire
IT environment in OpsMgr.
Integration with System Center Virtual Machine Manager 2008—
This integrates with the VMM 2008 and enables synergies such as
Performance Resource and Optimization (PRO) Tips, which provide virtual
machine recommendations based on observed performance and the ability to
implement the recommendation at the click of a button.
Notifications—
The notification system has been revamped and now sports an Outlook
rule style interface. And notifications can be generated for specific
alerts, and notifications can be sent out as high-priority emails.
Overrides View—
Rather than hunt for overrides within all the management packs, OpsMgr
R2 has an authoring view that shows all the overrides defined in the
system.
Improved Management Pack Maintenance—
OpsMgr 2007 R2 enables Microsoft management packs to be browsed,
downloaded, and imported directly from the console. It even includes
versioning and dependency checks, and the ability to search from
management pack updates.
Service Level Monitoring—
Applications can be defined from various monitored objects and the
service level of the application and be monitored and reported on
against defined target SLAs.
Better Scaling of URL Monitoring— The URL monitor now scales to thousands of websites without undue performance impact.
Improved Database Performance— The overall performance of the database and console has been dramatically improved.
These
improvements bring the platform to a new level of performance and
interoperability, while retaining the look and feel of the original
Operations Manager 2007 tool.
Explaining How OpsMgr Works
OpsMgr is a sophisticated
monitoring system that effectively allows for large-scale management of
mission-critical servers. Organizations with a medium to large
investment in Microsoft technologies will find that OpsMgr allows for an
unprecedented ability to keep on top of the tens of thousands of event
log messages that occur on a daily basis. In its simplest form, OpsMgr
performs two functions: processing monitored data and issuing alerts and
automatic responses based on that data.
The model-based
architecture of OpsMgr presents a fundamental shift in the way a network
is monitored. The entire environment can be monitored as groups of
hierarchical services with interdependent components. Microsoft, in
addition to third-party vendors and a large development community, can
leverage the functionality of OpsMgr components through customizable
monitoring rules.
OpsMgr provides for several major pieces of functionality as follows:
Management packs—
Application-specific monitoring rules are provided within individual
files called management packs. For example, Microsoft provides
management packs for Windows server systems, Exchange Server, SQL
Server, SharePoint, DNS, DHCP, along with many other Microsoft
technologies. Management packs are loaded with the intelligence and
information necessary to properly troubleshoot and identify problems.
The rules are dynamically applied to agents based on a custom discovery
process provided within the management pack. Only applicable rules are
applied to each managed server.
Event monitoring rules—
Management pack rules can monitor for specific event log data. This is
one of the key methods of responding to conditions within the
environment.
Performance monitoring rules—
Management pack rules can monitor for specific performance counters.
This data is used for alerting based on thresholds or archived for
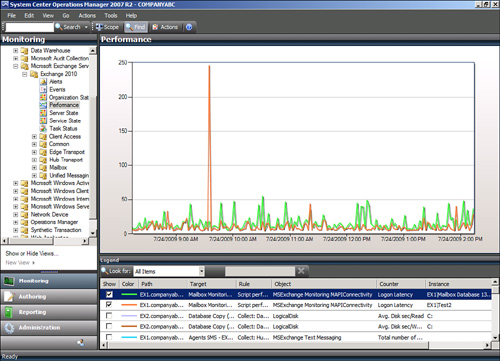
trending and capacity planning. A performance graph, as shown in Figure 1,
shows MAPI Logon Latency data for a couple of databases on the EX1
server. There was a brief spike in latency at approximately 9:45 a.m.,
but the latency is normally under less than 25.

State-based monitors— Management
packs contain monitors, which allow for advanced state-based monitoring
and aggregated health rollup of services. Monitors also provide
self-tuning performance threshold monitoring based on a two- or
three-state configuration.
Alerting—
OpsMgr provides advanced alerting functionality by enabling email
alerts, paging, short message service (SMS), instant messaging (IM), and
functional alerting roles to be defined. Alerts are highly
customizable, with the ability to define alert rules for all monitored
components.
Reporting—
Monitoring rules can be configured to send monitored data to both the
operations database for alerting and the reporting database for
archiving.
End-to-end service monitoring—
OpsMgr provides service-oriented monitoring based on System Definition
Model (SDM) technologies. This includes advanced object discovery and
hierarchical monitoring of systems.
Processing Operational Data
OpsMgr manages Exchange
Server 2010 infrastructures through monitoring rules used for object
discovery, Windows event log monitoring, performance data gathering, and
application-specific synthetic transactions. Monitoring rules define
how OpsMgr collects, handles, and responds to the information gathered.
OpsMgr monitoring rules handle incoming event data and allow OpsMgr to
react automatically, either to respond to a predetermined
problem scenario, such as a failed hard drive, with predefined
corrective and diagnostics actions (for example, trigger an alert,
execute a command or script) to provide the operator with additional
details based on what was happening at the time the condition occurred.
Generating Alerts and Responses
OpsMgr monitoring
rules can generate alerts based on critical events, synthetic
transactions, or performance thresholds and variances found through
self-tuning performance trending. An alert can be generated by a single
event or by a combination of events or performance thresholds. Alerts
can also be configured to trigger responses such as email, pages, Simple
Network Management Protocol (SNMP) traps, and scripts to notify you of
potential problems. In brief, OpsMgr is completely customizable in this
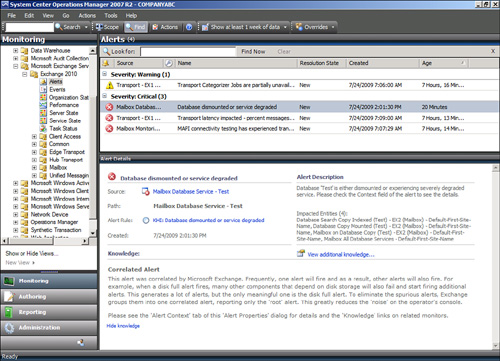
respect and can be modified to fit most alert requirements. An example
alert is shown in Figure 2.
The alert is indicating that the database Test on EX2 is dismounted.
Note also that this is a correlated alert, which is an Exchange Server
management pack specific function that reduces spurious alerts. A root
cause alert is generated, but correlated alerts are suppressed by the
management pack to avoid alert noise.
