The Full Architectural Landscape
Understanding all layers of your implementation is critical to
performance and tuning of your SQL Server application. Even the smallest
aspect, such as locking, could be at the heart of your poor performing
system. You just don’t truly know until you have evaluated all layers
and all interactions that come into play in your SQL Server application.
Figure 1 provides an overall perspective of all the layers of the architecture that you need to better understand and potentially tune.
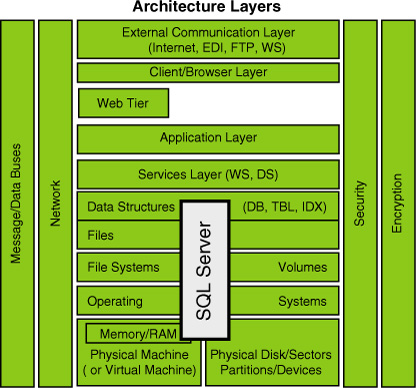
As you can see in Figure 1,
your SQL Server environment sits at the heart of many different layers.
They include the hardware (either physical or virtual footprint),
memory, physical disks/devices, operating system, file systems, and
database, to name a few. Quite often, a combined effort is needed
between the infrastructure, application, database, and network teams to
deliver the final, well-tuned SQL Server environment. If you can
understand that
you have not just a database problem or just an application design
problem, you will likely be more successful at delivering “optimal”
results when tuning your environment. You can treat Figure 41.1
as a checklist that you make sure you cover when doing performance and
tuning. Then, when you make a change in one layer, you can make sure you
test the full impact throughout all the other layers. Often, when you
solve one issue in one layer, other issues bubble up to the surface of
another layer.
Primary Performance and Tuning Handles
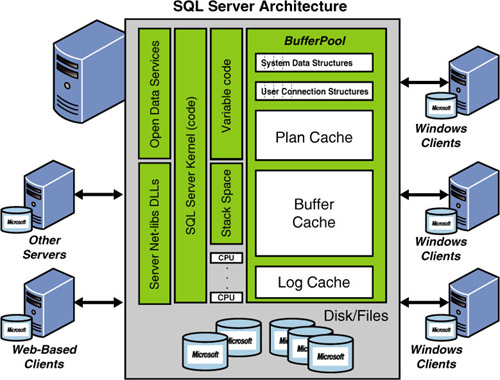
Now, let’s peel the onion a little more into the core architecture of SQL Server itself. Figure 2
shows the primary components within a SQL Server instance. The major
issues to worry about at the instance level are the caches that comprise
the memory pool and the number of CPUs available for processing to SQL
Server itself (shown as white boxes, not dark ones). Of course, the disk
I/O subsystem and files have to be carefully evaluated and used
effectively as well. All other darker boxed items such as the SQL Server
kernel are not within your control.
The rule of thumb here is to
treat these instance-level resources as “scarce” resources and monitor
the CPU and disk I/O for their saturation levels (never exceeding 80%)
and memory for its hit ratio and capability to service the desired
amount of concurrent work at or better than the service-level requirements of your end users (even during peak usage times).
Figure 3
shows a more readily recognizable combination of “handles” that are the
major areas a human can adjust to achieve optimal performance.
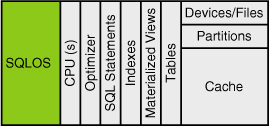
We’ve already mentioned CPU, cache/memory, and disk I/O; these and all the other handles listed in Figure 3
work together and must be considered together when doing performance
and tuning. A change in a SQL statement affects what the optimizer
(which makes decisions regarding how data is accessed in SQL Server)
will do to satisfy the query. The correct index allows the query to get
data the most effective way. The correct table design drastically
affects updates, deletes, inserts, and reads. The number of CPUs
available to SQL Server can invoke parallelism. What work is done in tempdb (and where tempdb
is located) can improve performance by 1000%. The index and table level
fill factor (free space), number of page splits, and page allocations
being done within your databases can hurt you by 1000%. Hints to the
optimizer can change the way execution is handled. And other issues such
as materialized views, partitions, and file placement (at the disk
subsystem level) directly contribute to the overall performance of every
SQL execution. Even something as simple as locking (or deadlocks) and
the consistent order of update operations within transactions can make
or break an entire SQL Server implementation.
We
explain a bit more of what to look for with the primary handles in the
guideline section later. For most development or production support
teams, tackling performance and tuning for SQL Server can truly be
overwhelming. The next section describes an orderly performance and
tuning methodology that most should be able to follow and use to yield
great results.
