Generating and Customizing a Basic Report
Table 2 shows the basic reports included in Project 2010.
Table 2. Available Basic Reports
| Category | Report Name |
|---|
| Overview | Project Summary
Top-Level Tasks
Critical Tasks
Milestones
Working Days |
| Current | Unstarted Tasks
Task Starting Soon
Tasks In Progress
Completed Tasks
Should Have Started Tasks
Slipping Tasks |
| Costs | Cash Flow
Budget
Overbudget Tasks
Overbudget Resources
Earned Value |
| Assignments | Who Does What
Who Does What When
To-do List
Overallocated Resources |
| Workload | Task Usage
Resource Usage |
Follow these steps to generate and print one of these basic reports:
1. | On the Project tab, in the Reports group, click Reports.
|
2. | Click the category that contains the report you want to generate and then click Select.
|
Basic reports that you have created are listed under the Custom category.
|
|
3. | Click the name of the report you want to generate and then click Select.
|
4. | Click Print to print the selected report.
|
If the basic reports
included with Project 2010 don’t contain the information you need and
you don’t have the option (or don’t want) to use visual reports, you can
create your own basic report. The steps for creating a custom basic
report are different, depending on what kind of report you are creating.
To create a custom basic task or resource report, follow these steps:
1. | On the Project tab, in the Reports group, click Reports.
|
2. | Click Custom and then click Select.
|
3. | On the Custom Reports dialog box, click New.
|
4. | Click Task or Resource in the Report type box and then click OK.
|
5. | On the Definition tab, complete the following:
- Name— Type the name of the report you are creating.
- Period— Choose the time period you want to display in the report.
- Count— Type the number of time periods you want to include in the report. For example, if you chose Weeks from the Period list, and you type 2 in the Count box, the report will display two weeks’ worth of data.
- Table— Choose which table type you want to display in the report.
- Filter— Choose how you want to filter the task or resource data.
- Highlight— Select this check box if you want to highlight the filtered tasks in the report.
- Show summary tasks— Select this check box to include summary tasks in your report.
- Gray bands— Select this check box to include gray lines to divide data visually in your report.
|
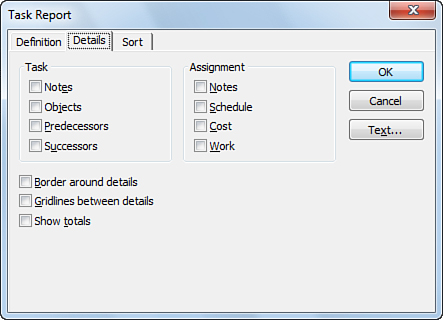
6. | On the Details tab (shown in Figure 4), choose the check boxes for the data you want to include in your report and select or clear the Border around details, Gridlines between details, and Show totals check boxes to adjust the formatting for your report.

|
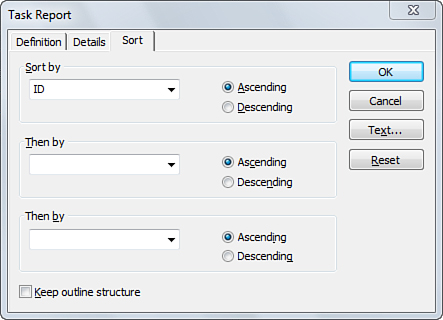
7. | On the Sort tab (shown in Figure 5), use the Sort by and Then by lists with the Ascending or Descending option to choose the order in which data in your report should be listed.

|
8. | Click OK to finish creating your custom report.
|
Follow these steps to create a custom basic monthly calendar report:
1. | On the Project tab, in the Reports group, click Reports.
|
2. | Click Custom and then click Select.
|
3. | On the Custom Reports dialog box, click New.
|
4. | Click Monthly Calendar in the Report type box and then click OK.
|
5. | Type a name for the new report in the Name box.
|
6. | Click Filter and choose what data you want to appear in the report.
|
7. | Select the Highlight check box if you want to highlight the filtered tasks in the report.
|
8. | Click Calendar and choose which calendar you want to use in the report.
|
9. | Select or clear the Gray nonworking days, Solid bar breaks, and Print gray bands check boxes to control how the report displays the calendar.
|
10. | Under Show tasks as, choose whether you want the tasks in the report to display as Bars, Lines, or Start/Finish dates.
|
11. | Under Label tasks with, select or clear the ID, Name, and Duration check boxes to control what information is displayed for the task in the report.
|
12. | Click OK to finish creating your custom report.
|
Crosstab reports include task and resource information spread across a certain number of time periods.
To create a custom basic crosstab report, follow these steps:
1. | On the Project tab, in the Reports group, click Reports.
|
2. | Click Custom and then click Select.
|
3. | On the Custom Reports dialog box, click New.
|
4. | Click Crosstab in the Report type box and then click OK.
|
5. | On the Definition tab, type a name for the new report in the Name box.
|
6. | Under Crosstab, complete the following:
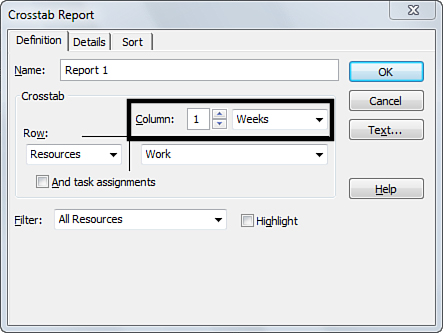
- Column— Type the number of time periods you want to include, and then choose which time period you are using. For example, type 4 and then choose Weeks. Figure 6 shows the column options.

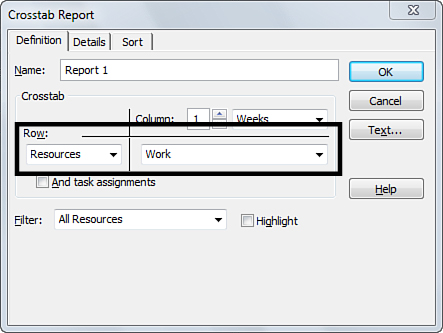
- Row— Choose whether you want to display Tasks or Resources in each row and then choose which field you want to display across the time period columns. Figure 7 shows the row options.

- And resource assignments/And task assignments— Select this check box to include assignment information in the report. If you selected Resources in the Row list, this check box is labeled And task assignments. If you selected Tasks in the Row list, this check box is labeled And resource assignments.
|
7. | Click Filter and then choose what data you want to appear in the report.
|
8. | Select the Highlight check box if you want to highlight the filtered tasks in the report.
|
9. | On the Details tab, choose the check boxes for data you want to include in your report and then choose from the following options:
- Show zero values— Select this check box if you want to display a zero when no data has been entered.
- Repeat first column on every page— Select this check box to display the row headers on each page of the report.
- Date format— Choose the format you want to use for dates in your report.
|
10. | On the Sort tab, use the Sort by and Then by lists with the Ascending or Descending option to choose the order in which data in your report should be listed.
|
11. | Click OK to finish creating your custom report. |