The first concept we have to understand when learning about monitoring
is that Analysis Services is a process running as a service on a
Microsoft Windows operating system. Running as a service, it usually
starts when the operating system starts and is running even when no
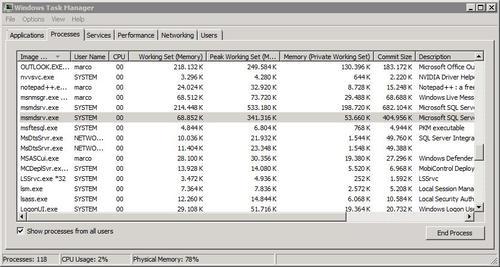
users are connected. The process name is msmdsrv.exe
and knowing this name is very important because it allows us to
recognize the Analysis Services process in lists of all processes
running on a server, for example when we're using the Task Manager
as in the following screenshot.
However, let's first concentrate on the following screenshot:
As Analysis Services is a
Windows process, the first thing we can analyze is the interaction
between that process and the hosting operating system. It's the
operating system that provides a running process the resources that it
needs, and that are shared with other processes: CPU, memory, and I/O.
Resources shared by the operating system
It is important to
understand the interaction between Analysis Services and the resources
provided by the operating system, because at the end of the day almost
every bottleneck causes by an abnormal consumption of resources by a
process.
We will examine the
behavior of Analysis Services using several tools. It is important to
point out that we should run our tests when there is no other activity
on our server, so we can reduce the amount of noise in our measurements.
The only exception is when we're trying to reproduce real-world
conditions, such as processing a partition when we have both SQL Server
and Analysis Services running on the same server.
CPU
Analysis Services consumes
CPU during two operations: processing and querying. Many of the
operations performed by Analysis Services can scale on multiple cores.
We won't go into any detail here about the extent to which each single
operation can scale on multiple cores, simply because this might be
subject to change in future releases or service packs. However, Analysis
Services can scale up because it runs multiple operations in parallel
(for example, in Enterprise Edition multiple objects can be processed in
parallel), but also because a single operation (for example, processing
a single partition) can be executed across several threads.
During partition
processing, CPU is used mainly to build aggregations. If a partition
doesn't have any aggregations designed, then CPU usage will be minimal.
However, as we will explain in more detail later on, CPU consumption
will only be high during partition processing if there is enough RAM
available for Analysis Services, and memory paging is kept to a minimum.
If we don't have enough physical memory for Analysis Services, we will
see long processing times even if there is little CPU usage. In general,
having high CPU usage during processing is a good thing because it
generally means that there are no other bottlenecks in memory or I/O
operations. If we want to reduce processing times when we already have
high CPU usage, we need to either reduce the number of aggregations in
the cube design or add more CPU cores on the server running Analysis
Services.
During querying, CPU is
used by Analysis Services to perform calculations on the data that has
been requested by a query. Most of these calculations scale on a
multi-core server, but sometimes (and this happens more often than
during processing) it might not be possible to parallelize an operation
across several threads. In such cases a single query cannot take
advantage of a multi-core server. For example, the Formula Engine is
single-threaded whereas the Storage Engine is multi-threaded. If the
query has complex MDX calculations, the Formula Engine can only use a
single CPU. This scenario can be recognized by observing the CPU usage
of the msmdsrv.exe process while a
single MDX query is executing. If there is a bottleneck in the Formula
Engine, the process does not consume more than the equivalent of one
core. In other words, on an 8 core server we will see a constant
consumption of 1/8th of our available CPU, that's to say 12 to 13%.

In such cases, there are two
ways we can try to optimize query response time. On one hand we can try
to change our cube design or our MDX query to enable greater parallelism
during query execution; on the other, we can try to reduce the time
needed for a sequential operation, for example, by reducing the size of
an intermediate fact table used in a many-to-many dimension
relationship, or by rewriting MDX to use bulk mode instead of
cell-by-cell mode.
In general, Analysis Services
can consume a lot of CPU resources during processing and, depending on
the conditions, also while running queries. We need to bear this in mind
when specifying servers for Analysis Services to run on, or when
deciding if Analysis Services should be installed on the same server as
other CPU-intensive applications.
Memory
Analysis Services, like any
other process in Windows, requires memory from the operating system,
which in turn provides blocks of virtual memory. Each process has a
separate address space that is called a virtual address space.
Each allocation made by a Windows process inside the virtual address
space gets a part of the operating system virtual memory, and that might
correspond to either physical RAM or
disk paging file. The decision as to whether a page of memory (which
corresponds to 4K) is in physical RAM or is moved to the paging disk
file is up to the operating system. This concept is very important,
especially when we have several other services running on the same
server, like Reporting Services, Integration Services, and the
relational engine of SQL Server itself.
In order to understand
how much virtual and physical memory a process is using, it is important
that we know how to read the numbers provided by Task Manager.
The total amount of virtual memory requested by a process is displayed in a column called VM Size in the Task Manager up to Windows XP/Windows Server 2003. Starting from Vista/Windows Server 2008, it has been renamed Commit Size.
The total amount of physical RAM used by a process is displayed in a column called Mem Usage in Task Manager up to Windows XP/Windows Server 2003. Starting from Vista/Windows Server 2008, it has been renamed Working Set (Memory).
A better column to watch in Vista/Windows Server 2008 if we want to monitor the physical RAM consumed by a process is Memory (Private Working Set), which is a subset of the Working Set (Memory)
counter that includes only the data that cannot be shared with other
processes. However, these two numbers shouldn't be too different for
Analysis Services.
The virtual memory manager in
Windows is a complex system that aims to optimize the usage of physical
memory, sharing data between processes whenever it is possible, but in
general isolating each virtual address space from all the others in a
secure manner. For these reasons it is not easy to interpret the
counters we just mentioned and it could be useful to recap how virtual
memory allocation works in Windows.
As we mentioned, data can be
shared across different processes. For example if two different
processes use the same DLL, the physical memory containing DLL code is
shared between both processes using read-only pages, regardless of the
virtual position of the code in each virtual address space. However,
this feature is not particularly important for Analysis Services because
most of the memory is consumed for data and it is private to the
process. For this reason, for the rest of this section we will
concentrate on private memory and not on shared memory.
When a process
allocates private memory, as Analysis Services does when it requires
space for its data, it is requested from virtual memory. When that
memory is written the operating system ensures that the page is in
physical RAM. When there is not enough RAM to hold all the virtual
memory pages used by running processes, the operating system moves older
pages from RAM to disk. These pages will be recalled from disk as soon
as a process needs to read or write data there. This activity is called memory paging
and we want it to happen as little as possible. One way to stop it
happening would be to remove the paging file from the operating system.
This is possible using the No paging file setting, but we do not recommend using this option on a server running SQL Server or Analysis Services.
There has been a lot of
discussion over the years about what the "right" size for the Windows
paging file is, and there have been a number of suggestions made that
are simply wrong. There are, for example, several formulas around based
on the amount of physical RAM, and the most common uses what is reported
in the Virtual Memory
dialog box, which is 1.5 times the physical RAM in the system. However,
most of these suggestions are baseless and inherited from an era where
the RAM of a server were measured in hundred of Megabytes.
Today we might have tens
of Gigabytes of RAM and paging 1.5 times this amount of data seems
crazy, even just for the time required to read and write that much data
(we are talking about minutes, not seconds, here). There are only two
conditions that justify a big paging file size: if we need a full memory
dump in the event of a system crash/blue screen then the size of the
paging file must be at least the amount of physical RAM; and, if a
kernel memory dump is required, then a variable amount of paging file is
required, up to the amount of physical RAM but generally lower than
that.
Where only a small memory
dump is required as a result of a blue screen, the size of the paging
file only has an impact on the performance of the dump. Having a few
Gigabytes should be enough even on servers with tens of Gigabytes of
RAM. If you want to work out what a good paging file size would be for
your server, we suggest readinghttp://tinyurl.com/PagingSize andhttp://support.microsoft.com/kb/889654, and also http://tinyurl.com/VirtualMemory, which is a more complete description of virtual memory, written by Mark Russinovich.
Thus, we have a paging file and
we need to optimize its use; ideally Analysis Services should not use
it at all. If Analysis Services were the only process running on the
system, it would be sufficient to set its memory limits to a value that
doesn't exceed the amount of physical RAM of the system. In fact, the
default settings of Analysis Services are below this limit, but they
don't take into account that other memory-hungry processes may run
concurrently on the same machine. For example, it's quite common to have
both SQL Server and Analysis Services running on the same machine.
Think what would happen when we processed a cube, which of course would
mean that Analysis Services would need to query the fact table in SQL
Server: both services require memory and paging to disk could be
unavoidable. There is a difference between SQL Server and Analysis
Services in terms of memory management, in that SQL Server can adapt the
amount of virtual memory it requests from the operating system to the
amount of physical RAM available to it. Analysis Services is not as
sophisticated as SQL Server and does not dynamically reduce or increase
the size of its requests for memory to the operating system based on
current available physical memory.
Another reason for
paging physical memory to disk is the System File Cache. By default,
Windows uses the available unused physical memory as System File Cache.
This would be not an issue if the concept of "unused" was really of
memory not used by anyone. If applications or file sharing result in a
lot of sustained cached read I/O, the operating system gives physical
RAM to the file cache and paginates the memory of idle processes if
necessary. In other words, if we were working on a 16 GB RAM server and
we copied a 20 GB file containing a backup file to an external disk, we
could paginate all the memory used by Analysis Services if it was not in
use during the copy. To avoid this kind of situation we could reduce
the size of the paging file (if virtual memory cannot be paginated to
disk, it has to be kept in physical RAM) or use the SetCache utility that is discussed here:http://tinyurl.com/SetCache.
The memory requested by a process
is always requested as virtual memory. In situations where the virtual
memory allocated by Analysis Services is much larger than the available
physical RAM, some Analysis Services data will be paged to disk. As we
said, this could happen during cube processing. We should avoid these
situations by configuring Analysis Services' memory settings (more on
which we discuss later) so that they limit the amount of memory that can
be allocated by it. However, when no other processes are asking for
memory, we might find that having limited Analysis Services' memory
usage in this way we are preventing it from using extra memory when it
needs it, even when that memory is not used by anything else.
I/O operations
Analysis Services
generates I/O operations both directly and indirectly. A direct I/O
request from Analysis Services is made when it needs to read data from
or write data to disk; and when it sends query results back to the
client, which involves an inter-process communication, typically made
through network I/O operations. The indirect I/O requests generated by
Analysis Services come from paging disk operations, and it is very
important to be aware that they can happen, because they cannot be seen
using the performance counters we might typically monitor for Analysis
Services. Paging operations are not visible to the Analysis Services
process and can be seen only by using the appropriate operating system
performance counters, like Memory: Pages / sec.
As we said, there
are two different types of directly generated I/O operation that we need
to worry about when monitoring Analysis Services. First, there are
disk-related operations, which are made when Analysis Services processes
cubes and dimensions (mainly to write data to disk) and when Analysis
Services reads cube data to answer queries. Monitoring reads to disk is
important if we are to spot situations where more RAM or more
aggregations are needed to improve performance. Another I/O operation
generated by Analysis Services is the transfer of query results to the
client. Usually this is not a slow operation, but if a query returns a
very large number of cells in a cellset (for example, a list of one
million of customers with several measure values for each one) the query
response time might be affected by the time needed to transfer the
cellset from the server to the client. Take a look at network traffic to
understand if this is a possible issue.
