Analysis Services memory management
Analysis Services has its own
Memory Manager, which provides allocation services for all of its
components, distributing the memory that it allocates from the operating
system. It is important to understand the implications of this for
virtual and physical memory, because in extreme conditions Analysis
Services might continue to allocate virtual memory even if there is no
more physical RAM available, thus increasing disk paging, and possibly
carrying on until it reaches the limit of allocatable virtual memory
(for example when paging disk cannot increase over a certain quota).
Even if we don't get a memory allocation error, if allocation requests
go out of control we'll end up with a very slow system because it will
always be busy paging memory to disk.
Memory differences between 32 bit and 64 bit
Having talked about
memory, it is important to make a distinction between the 32 bit and 64
bit versions of Analysis Services. Nowadays, any serious Analysis
Services deployment should use the 64 bit version. However, we might
still encounter legacy servers, or simply small deployments running on
virtual machines that use a 32 bit operating system. For all these
reasons, it makes sense to discuss the differences between the 32 bit
and 64 bit versions of Analysis Services regarding memory management.
Regardless of the
physical RAM installed on a system, if Analysis Services is running on a
32 bit operating system it can only address a maximum of 2 GB or 3 GB
of virtual memory (it depends on whether we set the /3GB switch in the boot.ini file seehttp://support.microsoft.com/kb/833721
for further details). This limit can be an issue for scalability and
performance. First of all, even if there was more physical memory
available, a process cannot use more virtual memory than is available in
its virtual address space. Unlike SQL Server, the Analysis Services
memory manager cannot use services like AWE to access more memory. So as
we can see, it is important that the memory manager doesn't try to
allocate more virtual memory than can be addressed because this will
cause errors in Analysis Services.
With the 64 bit version of
Analysis Services, there are no practical limits for virtual memory
allocation. However, this doesn't prevent memory allocation errors,
because we can still reach the limit of virtual memory that can be
allocated, which is the sum of the total physical memory and paging
file. This condition is much more frequent on a 64 bit server than on a
32 bit one, but if we understand how this can happen we can also apply
the right countermeasures.
Controlling the Analysis Services Memory Manager
The default settings of the
Analysis Services Memory Manager work well in most cases. However, there
might be scenarios where more tuning is required to optimize
performance or simply to prevent low memory conditions.
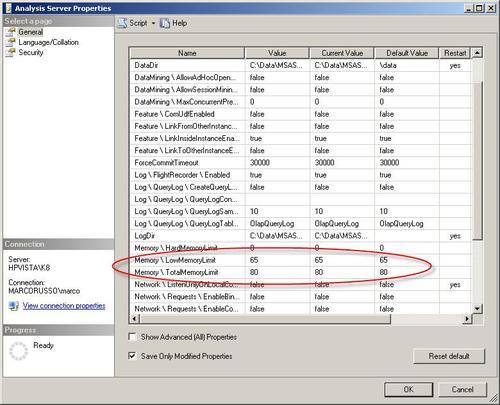
The main server properties that control the Analysis Services Memory Manager are shown in the following screenshot :
All Analysis Services server property values are held in a configuration file called msmdsrv.ini.
Whenever we edit server property values in SQL Server Management Studio
the changes are written back to this file. Some Analysis Services
server properties can only be seen by clicking the Show Advanced (All) Properties msmdsrv.ini which aren't visible at all in SQL Server Management Studio. The only way to access these properties is to edit the msmdsrv.ini file manually.
In the Memory category there are two important properties: LowMemoryLimit and TotalMemoryLimit. For these properties, values greater than 100 are absolute values (scientific notation is supported in msmdsrv.ini)
in bytes. Values of less than 100 are interpreted as a percentage,
where the reference value of 100% is calculated as the minimum of the
physical memory and the virtual memory available for a process. So, for
example a value of 100 would be interpreted as follows: on a 32 bit
server with 8 GB of RAM, there is still a 2 GB limit on addressable
memory (or 3GB if we have /3GB option
enabled) so it would be interpreted as 2 GB; on a 64 bit server with 8
GB of RAM it would be interpreted as 8 GB; on a 32 bit server with only 1
GB RAM it would be interpreted as 1 GB. Here's what each of these
properties actually represents:
LowMemoryLimit
defines the point at which the server is low on memory. The default
setting for a single instance installation is 65 (65%), and that is
appropriate in most cases, but if we had other processes on the same
machine we might want to use a lower value. If we want to know the
actual value that a percentage setting represents, we can look at the MSAS Memory / Memory Limit Low KB performance counter.
TotalMemoryLimit
is the maximum percentage of virtual memory that Analysis Services will
use. The default is 80 (80%) and again this is appropriate in most
cases. If we want to know the actual value that a percentage setting
represents is, we can look at the MSAS Memory / Memory Limit High KB performance counter.
The Analysis Services Memory Manager will carry on requesting memory
from the operating system until memory usage reaches the value specified
in TotalMemoryLimit. At the same time, though, it also tries to reduce memory usage when it reaches the LowMemoryLimit: when memory usage is between LowMemoryLimit and TotalMemoryLimit, Analysis Services tries to reduce memory requests and to free up memory previously allocated.
However, it takes time to free
up memory and there are also some types of internal allocations that
cannot be freed up. For these reasons, it is not always possible to
control the memory allocated by Analysis Services and increasing the gap
between LowMemoryLimit and TotalMemoryLimit
gives Analysis Services more leeway to react to changes in memory
usage. Making the gap between these two properties' values too small is
not a good idea, and the default values in Analysis Services 2008
generally provide a good balance (Analysis Services 2005 had a LowMemoryLimit of 75%, which proved to be too high in some cases).
Finally, remember that
the properties we have looked at here only control the Analysis Services
Memory Manager, and not any other virtual memory allocations made by
components related to Analysis Services: for example, an Analysis
Services stored procedure could allocate its own memory directly from
the operating system, outside of the control of the Memory Manager.
The most important thing to
remember is that Analysis Services requests virtual memory from the
operating system and cannot control whether it is using physical RAM or
not. This is intentional. Analysis Services might have a pattern of use
very different from SQL Server (which has a completely different model
to handle memory allocation) and paging memory to disk could be a good
compromise during periods of low usage, especially if other services
like SQL Server are running on the same server. However, if paging
activity becomes an issue, we can try to reduce the number memory
requests made by Analysis Services to the operating system. First, we
can set the LowMemoryLimit property to a lower value, making the Memory Manager more aggressive in freeing up memory. If this is not enough, we set the TotalMemoryLimit property to a lower value too. Changing these properties doesn't require restarting the service.
Out of memory conditions in Analysis Services
So far, we have
explained how to control the Analysis Services Memory Manager at a high
level, but we also said that in most cases it is better to not change
the default settings except in certain circumstances. Another reason why
we might want to change these settings is when we find Analysis
Services has run out of memory. This can happen when the operating
system cannot provide the memory requested by Analysis Services, as in
the following scenarios:
Processes
other than Analysis Services are consuming virtual memory. Regardless of
the actual use of memory made by Analysis Services, if other processes
consume virtual memory, new allocations might be denied to Analysis
Services when it requests them.
Analysis
Services consumes too much memory, using up all the virtual memory
available. This might happen under heavy load and we cannot completely
control this by changing the memory settings of Analysis Services.
If we experience out of
memory conditions, increasing the size of the paging file is a
workaround that will at least prevent Analysis Services from crashing,
even if it will not help performance. If the problem is caused by too
many concurrent processes, another solution could be limiting the memory
usage of these other processes (for example, SQL Server does have
settings to limit its memory allocation). However, if the cause of the
out of memory condition is a program or a service other than Analysis
Services with memory leaks, a better idea would be to investigate on the
cause of the excessive memory allocations, replacing the leaking
application version with a fixed version or at least isolating it on
another server.
As we said, it's not all that common to find an Analysis Services instance that consumes too much memory, because TotalMemoryLimit
is based on available physical RAM and virtual memory is typically
larger than physical RAM. Therefore, if there are no other processes
that are consuming significant amounts of RAM and Analysis Services is
the only "big service" running on a server, a reasonable amount of
paging file should be enough to avoid such situation. However, in the
real world we hardly ever find servers with only a single service
running on them.
The TotalMemoryLimit
is not an absolute limit for the Analysis Services Memory Manager: as
we said, virtual memory allocated by other libraries (such as stored
procedures) used by Analysis Services is not under the control of the
Memory Manager. The Memory Manager itself might be unable to respect the
setting. Under heavy load, memory requests cannot be avoided; sometimes
memory requests come too fast to allow cleaning of older, rarely-used
allocations in a timely manner. TotalMemoryLimit
In both cases, the result is that the memory allocated exceeds the TotalMemoryLimit.
This is not an issue in itself, but it could break the balance of
memory usage between all the processes running on the server. Therefore,
we cannot assume that Analysis Services will always respect the limit
we have defined, especially when the gap between LowMemoryLimit and TotalMemoryLimit is tight.
Here are some possible causes
of the type of heavy load on Analysis Services that could result in
abnormal virtual memory consumption:
Parallel
processing if a server has many processors available, parallel
processing of cubes and dimensions will require a larger amount of
memory. To reduce memory usage we can try to decrease the amount of
parallelism during processing.
Too
many queries and/or concurrent users in this case we should check the
usage of cache and aggregations (adding more aggregations and rewriting
queries and calculations if necessary), and make sure that sufficient
memory is available to Analysis Services to support the number of
concurrent sessions.
Security
security has implications on Analysis Services' ability to share cache
between users, which means more work is likely to be taking place for
each query. Using the Enable Visual Totals option with Dimension
Security also has an impact on aggregation usage. In both cases we
should check if we can make structural changes to the cube or to how we
have implemented security that can improve aggregation and cache usage.
A final consideration is that
an out of memory condition should be prevented by dealing with memory
issues in advance. Memory issues cause paging, and paging causes bad
performance. Therefore, monitoring operating system performance counters
is the first step to ensuring that Analysis Services performs as well
as possible.
Sharing SQL Server and Analysis Services on the same machine
Many Analysis Services
installations share a server with SQL Server. This happens mainly
because of licensing: the license required for Analysis Services is in
fact a SQL Server license, so having both installed on the same machine
requires only one server license to be purchased. However, this
configuration has a hidden cost: since memory and sometimes CPU must be
shared between these services.
It is not always true that
it is a good idea to install Analysis Services on a different server to
SQL Server, though. If we don't have a multi-terabyte data warehouse and
the hardware necessary to support it, chances are that the bandwidth
available between two servers could be a bottleneck compared with the
faster transfer rate that we could have if Analysis Services and SQL
Server were installed on the same server. This is particularly important
during cube processing. There is also the question of cost. Often
Analysis Services and SQL Server use neither CPU nor disks at the same
time, and only require a modest amount of memory to cache data.
Nowadays, 64-bit servers allow us to double the memory on a server at a
fraction of the cost necessary to provide a new server with the same
amount of RAM. In our experience, adding RAM to a server has a much
better ROI than investing in a new server. In the end, having both
services on the same server results in faster processing and cheaper
hardware cost, although it can of course increase the chance of memory
issues.
As we have seen in previous
sections, we can try to control the memory usage of Analysis Services
and SQL Server on servers that host both services. However, our
suggestion is to make changes only if it is really necessary. SQL Server
has a default setting that allocates memory if no other processes are
claiming it. When Analysis Services is running and requests memory, SQL
Server might release some of the memory it has previously allocated
because it can detect when a system starts pagination. This is not true
for Analysis Services. Memory allocated by Analysis Services up to the LowMemoryLimit
threshold is never released. However, it could be paginated. Sometimes,
it is better to page a section of the Analysis Services cache than drop
it completely and have to recalculate the values it contains for future
queries. Therefore, even if Analysis Services allocated memory and SQL
Server pushed some of this memory out to a paging file, this is not a
bad thing in itself. Only if paging activity (measured at the operating
system level) is continuous, for example because both Analysis Services
and SQL Server are used intensively at the same time, then we might want
to try to limit the memory used by one or both services. Last of all,
remember that any attempt to optimize memory settings should be tested
properly: we should compare system performance before and after making
any changes, measuring the impact on things like query response time and
not only looking at how they affect performance counter values.
