Tools to monitor resource consumption
The first tools we're going to
look at for monitoring resource consumption are Task Manager and
Performance Monitor. These tools are available on any server we might
use to host an Analysis Services instance and they can also be used to
monitor any other process that might compete with Analysis Services for
the use of system resources.
Windows Task Manager
The Windows Task Manager is a
utility, included with any current Microsoft Windows operating system,
which provides information about running applications and their system
resource usage (for example CPU, memory, and network activity). Task
Manager also allows us to kill a process and change its priority.
However, we are only interested in the monitoring features of this tool.
As we mentioned before, there have been some changes and improvements
in Task Manager moving from the XP/2003 version to the Vista/2008
version. From here on, we will only focus on this latest release of the
tool.
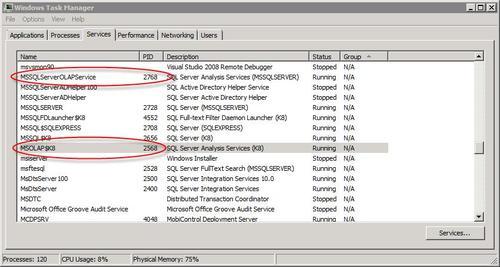
The Services
tab displays a list of services along with the process ID (PID) of each
service. In the following screenshot we can see that there are two
instances of Analysis Services running on the same machine: one is named MSOLAP$K8 a named instance called K8—and has the PID 2568, the other is named MSSQLServerOLAPServices, is the default instance and has the PID 2768.
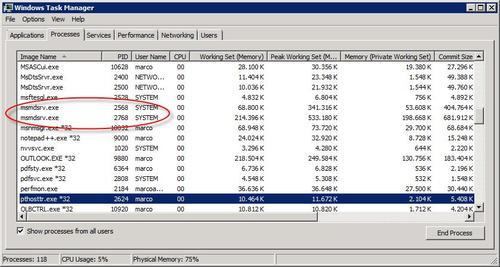
On the Processes tab we can distinguish between the two running msmdsrv.exe processes based on the PIDs that we have seen on the Services tab. The following screenshot also shows several other columns (chosen through the View / Select Columns menu) with information about CPU and Memory usage that we'll now explain.
The CPU
column shows what percentage each process uses of the total processing
power available on the system. On a dual core machine, a single thread
can consume up to 50%; but the same thread can only consume up to 25% on
a quad-core system. Analysis Services scales well on multiple cores in
most scenarios, so we should expect to see very high CPU values for
Analysis Services during cube processing and query resolution.
Working Set (Memory) and Commit Size
are the most important counters that we can analyze and correspond to
the physical RAM and virtual memory used by the process. As we said
before, Memory (Private Working Set) is a value that, for Analysis Services, should be slightly lower than Working Set (Memory).
Therefore, for our purposes, they can be used almost at the same way.
What is interesting is the comparison between virtual memory usage and
physical RAM usage. When virtual memory usage is higher than physical
RAM usage, probably part of the Analysis Services cache has been paged
to disk. This condition is not an issue if Analysis Services does not
have a high workload, but if it happens when users are running queries
and does not improve over time (the physical RAM usage should grow to
almost match the virtual memory usage), then we should investigate the
cause of the issue. The server might have insufficient physical RAM or
there could be other processes that are consuming physical RAM at the
same time. In both cases, adding RAM would be the best way to solve the
problem. We can also mitigate the issue by moving other processes to
different servers, if we can afford to do so, or by reducing the amount
of memory available to Analysis Services . Page Faults Delta is another counter that we can monitor to check which process is responsible for any paging activity.
Performance counters
The Windows operating
system gathers data about system performance and exposes it through
performance counters, which can be displayed through a Microsoft Management Console (MMC)
snap-in called Performance Monitor. In reality, performance counters
are available through a set of APIs and there are third-party tools that
can access them too. We will use Performance Monitor, but the
concepts we are going to explain are valid regardless of the tool used
to display them. Moreover, in this section we will cover only operating
system counters, but there are also other counters specific to Analysis
Services instances .
Performance Monitor can be found by clicking the Administrative Tools | Performance shortcut in Windows XP/2003, and by clicking the Administrative Tools | Reliability and Performance Monitor
shortcut in Windows Vista/2008. There are differences in the user
interface of these two tools but they are not significant for the
purposes of this article. Performance Monitor can display performance
counter data captured in real-time, or it can be used to display a trace
session of performance counter data recorded using the Data Collector
Sets feature of Reliability and Performance Monitor in Windows Vista/2008 (a similar feature was named Performance Logs and Alerts
in the Performance management console in Windows XP/2003). Using this
trace data is very useful for monitoring a production server to detect
bottlenecks and measure average workload. We suggest reading the
documentation available athttp://tinyurl.com/CollectorSet to understand how to make good use of Data Collector Sets.

The memory counters are divided in two groups. A first set of counters, included in the Memory
category, provides information about the overall consumption of memory
regardless of the consumer (it could be a process, a driver, or the
operating system itself).
Pages/sec is the
number of pages read from and written to disk to resolve hard page
faults. An access to a page of virtual memory that has been paged to
disk generates this type of event; the cause is insufficient physical
RAM to satisfy all the memory requests.
Committed Bytes
is the amount of virtual memory requested by all running processes. If
this value is higher than the amount of available physical RAM, data has
been paged to disk. However, if the Pages/sec rate is low or null, data
paged to disk is not used often and as long as it does not need to be
accessed, there will be no performance problems caused by this
situation.
% Committed Bytes in Use is the ratio of Committed Bytes to Commit Limit,
which is the maximum amount of virtual memory that can be allocated (a
value slightly below the sum of physical RAM and paging file).
A second group is made up of performance counters that are available for any running process. This group is included in the Process
category and includes a few counters that we have already seen in Task
Manager, as well as other counters that are useful for analyzing the
state of an Analysis Services instance.
Virtual Bytes
is generally not so useful, because it represents the amount of virtual
memory used for both private allocations and file mapping (including
executable files).
Page File Bytes and Private Bytes are usually very similar for Analysis Services, and correspond to the Commit Size counter we have seen in Task Manager.
Page File Bytes Peak
is very important because it reports the maximum value reached by Page
File Bytes since the start of process execution, regardless of when we
started monitoring. If this value is higher than Page File Bytes, there
has been a reduction in the amount of memory requested by Analysis
Services, but since this peak has been reached before this usually
implies that it could be reached again in the future.
Working Set corresponds to the Working Set (Memory) value in Task Manager
Working Set—Private corresponds to the Memory (Private Working Set) value in Task Manager
Working Set Peak
is the maximum value reached by Working Set since the start of process
execution, regardless of when we started monitoring. This value can be
higher than the actual Working Set counter because, even if a process
has not released memory previously allocated, part of that memory may
have been paged as a result of memory activity by other processes. If
this happens with Analysis Services, we could investigate what other
processes are requesting memory concurrently on the same server.
The Disk I/O counters at the operating system level are divided up into two categories: LogicalDisk and PhysicalDisk.
The difference between these counters is significant when there are
multiple partitions on a physical disk or when we use operating system
support to create RAID volumes. When the RAID service is provided by the
disk controller, the physical disk and logical disk should be the same
unless we have several partitions on a disk.
Logical and Physical Disk Performance counters can be enabled or disabled by using the DiskPerf
command line utility available from the operating system. We can check
the state of these counters by simply running this utility without
parameters from the command line.
Here are the important counters available in these categories:
Current Disk Queue Length
represents the current number of queued requests to the disk. If this
number is constantly above the number of spindles plus 2, the disk
subsystem could be improved by adding spindles (to a RAID 0/10
configuration) or by using faster disks. If this number is below that
limit, even if there is a continuous workload on the disk, it will not
be the primarily cause of any performance issues.
%Disk Time
is a counter which should represent the percentage of time spent
accessing disk, but the calculation used could provide a value higher
than 100%.
Disk Read Bytes/sec
is important to determine if the speed of the disk subsystem
corresponds to its theoretical limits. There could be issues that make
this value lower: disk fragmentation, RAID overhead (for example during a
RAID rebuild), under-dimensioned LUN channels, and so on. If this
number is near to the physical limits of the disk, we can improve
performance by reducing data, distributing data to different disks, or
by using faster disks.
Disk Write Bytes/sec
is also important to determine if the speed of the disk subsystem
corresponds to its theoretical limits. Write performance is extremely
important for Analysis Services processing operations. Other than the
issues we already described for the Disk Read Bytes/sec counter, a
common source of issues during writing is the use of a RAID 5 volume.
Writing on RAID 5 volumes is slower than normal volumes, and write
performance is inversely proportional to the number of spindles in a
RAID 5 configuration.
Know your hardware configuration!
Too many times we have seen
performance issues caused by a lack of knowledge about hardware
configuration. For example, RAID 5 disks are very common but they can be
a performance nightmare for ETL and cube processing. The data we
collect from performance counters only makes sense if we can compare it
to the known physical limits of our hardware. Therefore, we need to know
how to interpret terms as LUN, RAID and spindles; we also need to know
exactly what hardware we're using in our own environment.
For disk-related terminology, the following glossary is a good place to start:http://tinyurl.com/DiskGlossaryTerms. A description of all possible RAID levels is available athttp://en.wikipedia.org/wiki/Standard_RAID_levels andhttp://en.wikipedia.org/wiki/Nested_RAID_levels.
If we wanted to see data on I/O operations broken down by process, we can use some of the counters available in the Process category.
IO Data Bytes/sec
is the amount of data transferred in I/O operations. For Analysis
Services this includes reads and writes to files and communication
between client tools and Analysis Services. Monitoring it can help us
understand if a lack of CPU activity while queries are running on
Analysis Services is the result of I/O operations or not.
IO Write Bytes/sec is the amount of data transferred in write I/O operations
IO Read Bytes/sec is the amount of data transferred in read I/O operations
Finally, we have the Processor
category of counters, which provides data on the usage of each
processor as well as aggregated values for all processors on the server.
When monitoring Analysis Services the only significant counter is % Processor Time,
which allows us to compare the CPU usage of Analysis Services to the
total CPU usage of all processes on the server. If, for example,
Analysis Services is consuming 50% of CPU and overall CPU usage is at
100%, then Analysis Services is sharing the CPU with other processes. In
this kind of situation, to free up resources for Analysis Services we
either need to move other processes to a different server, or we can add
more processing power to the server. To monitor the CPU usage of
Analysis Services we can use the % Processor Time counter from the Process category, and select the msmdsrv process.
Resource Monitor
With Windows Vista and
Windows Server 2008 a new tool has been introduced to allow us to
monitor the core performance counters easily: Resource Monitor, which can be found by opening the Reliability and Performance Monitor shortcut in Administrative Tools, or by clicking the Resource Monitor button in the Performance tab of Task Manager. The following screenshot shows Resource Monitor:

As well as giving us a concise view of the most important performance counters on a server, for each type of resource (Memory, CPU, and I/O, which is divided into Disk and Network) we can drill down into the details of each process's resource consumption, as shown in the following screenshot:
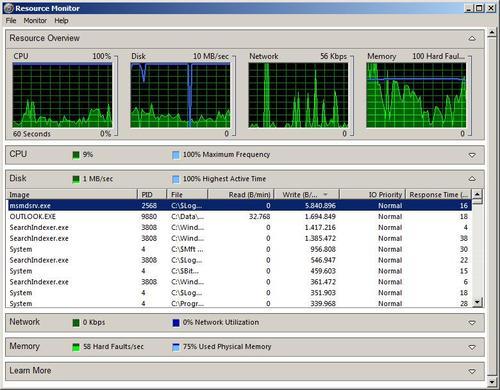
In the case of the Disk section, the details show one line for each open file. The Network section shows each open connection; Memory has a line for each process and CPU
has a line for each process or service running on the system (if a
single process hosts several services, their consumption is split across
several lines however, Analysis Services is hosted in a dedicated
process and so this is not relevant for us).
The only limitation of Resource Monitor
is that we cannot choose the columns we want to display, like we can do
with Windows Task Manager. However, the columns that are shown are well
chosen and should cover most of our immediate needs when we have to
monitor a server running Analysis Services.
