1. Monitoring Miscellaneous Counters and DMVs
Two general counters may
prove useful when monitoring SQL Server: Logins/Sec and User
Connections. Both of these counters should be part of your baseline so
you have something to compare against over time. They may be helpful
when trying to figure out gradual changes in the hardware resources
within your environment. These counters may also be useful when you are
trying to determine the reason database server resources are being
taxed. For example, if you have information showing that the number of
users within your environment just doubled, then that may save you a lot
of troubleshooting time.
2. Capturing SQL Server PerfMon Counters Using DMVs
In SQL Server 2008,
the DMV sys.dm_os_performance_counters
contains the same performance counters stored within SQL Server. So
instead of connecting the server and running the performance monitor,
you can query the sys.dm_os_performance_counters DMV and track the results of the monitor in the database.
3. Leveraging the SQL Server Profiler
SQL Server Profiler is a
graphical tool used to trace the events occurring within SQL Server. SQL
Server Profiler uses a large number of events and filters to capture
the data and information that interest you. From a monitoring
perspective, SQL Server Profiler is an awesome tool to help you quickly
identify what's running against your system or to monitor what's running
on your system for a period of time. Using SQL Server Profiler, you can
identify long-running queries, CPU-intensive queries, queries that
utilize a large number of IO, and many more events. Now let's take a
look at SQL Server Profiler and how to monitor events.
There are multiple ways to
launch SQL Server Profiler. Within SQL Server Management Studio, click
on Tools and the select SQL Server Profiler. You can also go to Start,
All Programs => Microsoft SQL Server 2008 =>Performance
Tools, and finally select SQL Server Profiler. For this example, let's
assume you connected to SQL Server Profiler from SQL Server Management
Studio. Once SQL Server Profiler launches, connect to the server and
instance that you want to capture events on. After you connect to the
SQL Server instance, you will be directed to the Trace Properties dialog
box, shown in Figure 1.
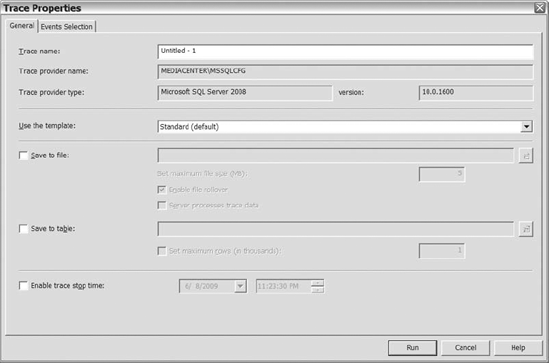
Reviewing Figure 1,
you will notice there are three decisions to make: which template you
want to use, where you want to save the file, and if you want to enable a
time for the trace to stop. You can decide if you want to store the
data within a table or a file. If you are tracing events on a busy
server, then you definitely don't want to write to table. You don't want
to increase writes to the databases on your server.
The Enable Trace Stop Time
option allows you to pick the date and time when you want the trace to
stop. So if you want the trace to stop after a given time, then you can
utilize this option so you don't have remember to manually stop the
trace.
Microsoft has eight templates
to help you trace events on your server. If none of the templates meets
your needs, then don't hesitate to use the Standard template. Once you
select the template that you want to use, click on the Events Selection
tab. Figure 2 shows the default events in the Standard template on the Events Selection tab.
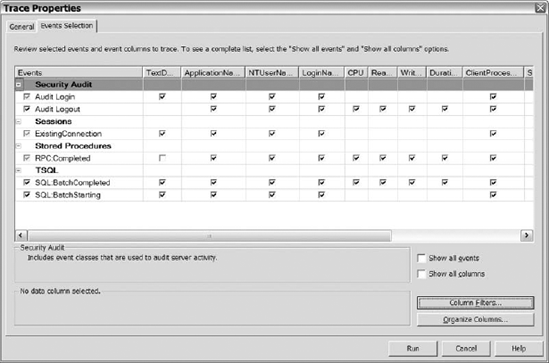
After you click this tab, you
can select the Show All Events and Show All Columns check boxes. Show
All Events displays all of the available events that you can monitor.
Show All Columns displays all of the available columns for each event.
You will quickly notice that there are a large number of events and
columns to monitor to help you identify problems on SQL Server.
If you want to monitor events
for a specific application, user, or any other available column on a
monitored event, then you want to modify your trace to filter for that
column. To add a filter to your trace, click on the Column Filters
button, and the Edit Filter dialog box will load (see Figure 3).
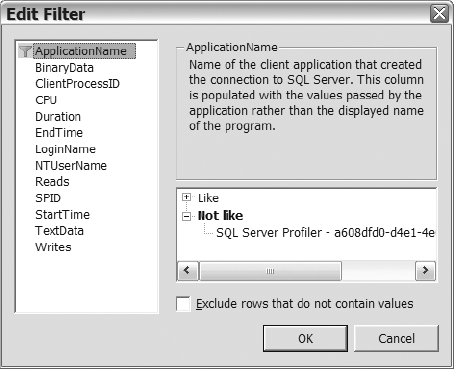
Once you are on the Edit Filter
dialog, select the column that you want to apply the filter to, and then
add the text to the appropriate option on the right side of the dialog.
Once you add all the filters that you want to apply and land back on
the Events Selection tab, then go ahead and click on the Run button to
start the trace.
One thing to keep in mind:
Running SQL Serve Profiler on the server itself can cause an increase in
CPU when you are capturing a large number of events. To prevent the
increase in resource utilization caused by SQL Server Profiler you can
run server side traces, which provide a minimal impact to your server.
