Unless your entire database fits in memory, then the
performance of your SQL Server is heavily dependent upon your disk IO.
Disk bottlenecks will impact the speed at which pages are moved in and
out of memory. Delays in moving pages in and out of memory ultimately
affect the performance of the application.
Monitoring disk IO can also be
a little tricky. Depending on the counters that you use, you have to
evaluate the results based on the number of disk spindles available on
the monitored physical disk. Table 1
lists some of the counters and thresholds used when monitoring disk IO;
it also lists if the number of spindles needs to be considered when
using the counter.
Table 1. Disk Counters and Their Recommended Values
| Counter Name | Description | Recommended Values |
|---|
| Physical Disk: Avg Disk Queue Length | The average number of reads and writes queued on the disk | > 2 per spindle |
| Physical Disk: Avg Disk Reads/Sec or Writes/Sec | The average number of reads/ writes from/to disk per second | <=10 ms outstanding (between 10 and 20 okay); > 20 ms (needs attention) |
| Physical Disk: Disk Reads/ Sec or Writes/Sec | The rate of read/write operations on the disk | > 85% of disk capacity |
| Physical Disk: % Disk Time | Show the busyness of the disk array | > 55% over continuous time |
| Physical Disk: Current Disk Queue | The number of processes waiting to be executed | |
| SQL Server Access Methods: Full Scans/Sec | The number of table and index scans that occur on your system | Baseline number should be as low as possible |
| SQL Server Access Methods: Page Splits/Sec | The number of page splits per second on your system | < 20 per 100 batches/sec |
Figure 1 shows PerfMon with the counters listed in Table 1.
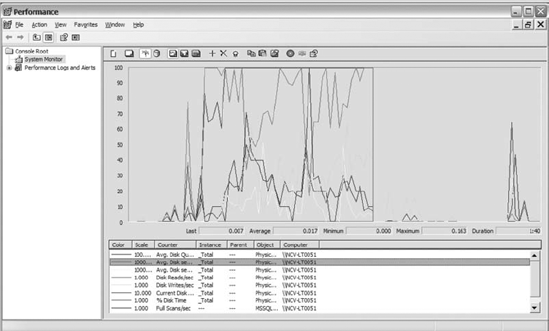
1. Disk IO with Windows Counters
The following list explains the Physical Disk object Windows counters listed in Table 1.
As you use those counters, remember that the results from some counters
must be interpreted in light of the number of spindles within the disk
array. For example, if disk D consists of 6 spindles and you are
monitoring the Avg Disk Queue length, the counter would have to be
greater than 12 before you have reason for concern.
Avg Disk Queue Length:
Represents the number of physical reads and writes queued on the
selected disk. When your disk IO subsystem is overwhelmed, physical disk
reads or writes have to wait before performing their actions. Keep in
mind, sustained values greater than two for each spindle requires
attention.
Avg Disk Reads/Sec or Writes/Sec:
Captures the average amount of time it takes to read/ write data to
disk. One benefit of this counter is that it measures disk latency. The
measurement of disk latency does not care about the number of spindles
within the array. The measurement of Avg Disk Reads/Sec or Writes/Sec
counter represents the amount of time in milliseconds it takes for the
actions to happen. When the counter exceeds 20 ms for a given disk,
research the cause of the increased read/write from/to the disk.
Reads/Sec or Writes/Sec:
Measures the number of reads or writes per second from/to disk. These
numbers need to be less than 85% of the disk capacity. The
specifications of your disk drives should identify the number of reads
and writes per second the drives support. Make sure the Reads/Sec and
Writes/Sec counters do not exceed 85% because the access time increases
exponentially beyond 85% capacity.
% Disk Time:
Represents the busyness of your disk drives. Drives that sustain more
than 55% over time indicate that your disks are overworked and that you
likely have a disk IO problem. Figuring out why your disks are so busy
will go a long way toward reducing IO problems.
Current Disk Queue:
Measures the current processes waiting for IO. Using this counter along
with % Disk Time may help you understand what is going on with your
disks. If your current disk queue is high and % Disk Time is above your
baseline, then that probably is an indicator that application processes
are delayed and your disks are bottlenecked.
2. Disk IO with SQL Server Counters
SQL Server also provides some counters to monitor factors that negatively affect the disk IO on your server. Table 1
mentioned the two SQL Server counters that we use the most to determine
how factors of SQL Server are impacting disk IO. These counters are
located in the SQL Server Access Methods object and are further described in the following list:
Full Scans/Sec:
Identifies the number of table and index scans occurring on your system
per second. Scans are IO-intensive and should run within your databases
minimally. If your scan counters are high, then identify the tables
that have a large number of scans against them.
Page Splits/Sec:
Represents the number of page splits per second that occur on your
system. Page splits occur when there is not enough space on a page to
add the data on an existing page. When the page splits, that causes
fragmentation and results in IO-intensive processes. Try to keep page
splits under 20 per 100 batches/sec. If the number of page splits is
greater than that, then review the fill factor you have set up on your
indexes and minimize it where appropriate.
Monitoring disk IO is
slightly more complex because you have to remember to keep the number of
spindles in mind when interpreting the results. Once you get familiar
with counters, then monitoring disk IO will be easier. Always use
multiple counters to identify disk IO problems, not just the results of
one counter. Using that method is more likely to save you time and
effort from venturing down the wrong path.
