Logo
programming4us
programming4us
programming4us
programming4us
Home
programming4us
XP
programming4us
Windows Vista
programming4us
Windows 7
programming4us
Windows Azure
programming4us
Windows Server
programming4us
Windows Phone
 
Windows Server

SharePoint 2010 PerformancePoint Services : Examining ProClarity Analytics Server Page Reports

- Free product key for windows 10
- Free Product Key for Microsoft office 365
- Malwarebytes Premium 3.7.1 Serial Keys (LifeTime) 2019
4/7/2011 3:22:48 PM

Tip

The ProClarity Analytics Server Page report was retained in PPS 2010 primarily as a bridge for customers who are still using ProClarity Analytics Server. You may want to read the Decomposition Tree report, which is an enhancement inspired by ProClarity that has been added to PPS 2010.


There are two ways to create a ProClarity Analytics Server Page report. One method is to select Other Reports from the Create tab in Dashboard Designer and then select ProClarity Analytics Server Page from the Report Template dialog box. The second method is to right-click a PerformancePoint list in the Workspace Browser, select Report, and then select ProClarity Analytics Server Page from the dialog box.

There are two prerequisites for using a ProClarity Analytics Server Page report:

  • You must deploy a ProClarity Analytics Server book to a ProClarity library.

  • You must have access to the location where you have deployed the ProClarity Analytics Server book.

In Figure 1, a ProClarity Analytics report has been deployed showing how different affiliates contribute to overall viewership.
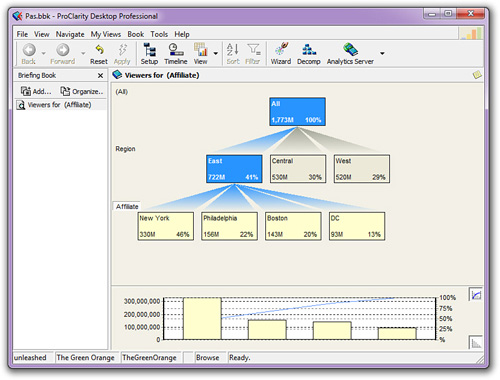
Figure 1. A ProClarity Analytics report that will be deployed for use in a PPS dashboard.

To add the report to a dashboard, after creating the report in ProClarity, you will configure the report in Dashboard Designer using the following properties: Server URL, Page, and Configuration options as seen in Figure 2. The Server URL option indicates the PAS server hosting the desired report, and the Page indicates the report to use.
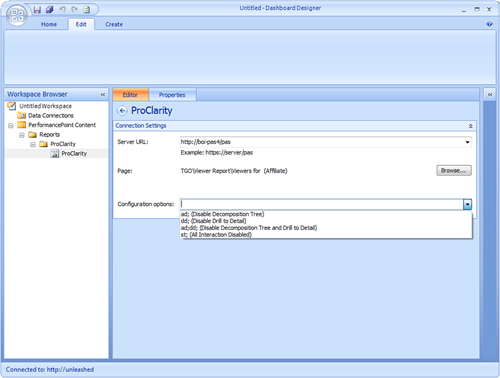
Figure 2. Specify the deployment properties in the Report Settings for your ProClarity Analytics Server Page report.

Note

The Configuration options enable you to restrict user interactivity. Some analytical operations can be performance-intensive. Restricting user interactivity can be useful to minimize the performance impact of PAS reports against the PAS or data source.


After the ProClarity Analytics Server Page report has been added to a dashboard, it should look like the report in Figure 3.
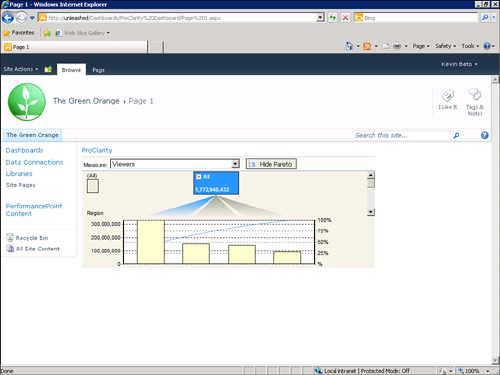
Figure 3. The ProClarity Analytics Server Page report has been added to a dashboard.
Other -----------------
- SharePoint 2010 PerformancePoint Services : Examining KPI Details Reports
- BizTalk 2010 Recipes : Orchestrations - Configuring a Send Port at Runtime
- BizTalk 2010 Recipes : Orchestrations - Binding Orchestrations
- BizTalk 2010 Recipes : Orchestrations - Creating Multipart Messages
- Windows Server 2008 R2 : File Server Resource Manager (part 4)
- Windows Server 2008 R2 : File Server Resource Manager (part 3)
- Windows Server 2008 R2 : File Server Resource Manager (part 2)
- Windows Server 2008 R2 : File Server Resource Manager (part 1) - Installing the File Server Resource Manager Tools & FSRM Global Options
- Windows Server 2008 R2 : Volume-Based NTFS Quota Management
- Exchange Server 2010 : Installing Edge Transport Monitoring Certificates (part 3) - Install the Agent on the Edge Transport & Configure the Agent to Use the Certificate
 
 
Top 10
- Microsoft Visio 2013 : Adding Structure to Your Diagrams - Finding containers and lists in Visio (part 2) - Wireframes,Legends
- Microsoft Visio 2013 : Adding Structure to Your Diagrams - Finding containers and lists in Visio (part 1) - Swimlanes
- Microsoft Visio 2013 : Adding Structure to Your Diagrams - Formatting and sizing lists
- Microsoft Visio 2013 : Adding Structure to Your Diagrams - Adding shapes to lists
- Microsoft Visio 2013 : Adding Structure to Your Diagrams - Sizing containers
- Microsoft Access 2010 : Control Properties and Why to Use Them (part 3) - The Other Properties of a Control
- Microsoft Access 2010 : Control Properties and Why to Use Them (part 2) - The Data Properties of a Control
- Microsoft Access 2010 : Control Properties and Why to Use Them (part 1) - The Format Properties of a Control
- Microsoft Access 2010 : Form Properties and Why Should You Use Them - Working with the Properties Window
- Microsoft Visio 2013 : Using the Organization Chart Wizard with new data
 
programming4us
Windows Vista
programming4us
Windows 7
programming4us
Windows Azure
programming4us
Windows Server