A KPI is a metric for
monitoring performance. In other words, a KPI is a metric or set of
metrics used to provide the status of how close the actual value of a
metric is to its target value.
Financial metrics
are typical applications of KPIs. For example, suppose that The Green Orange has
a production budget for each show. The producer allocates a fixed
budget for the show and the director must work within this budget to
complete the show. If the financial metric indicates that the director
is tracking toward spending less than the budgeted amount, he is
considered to be on target with his spending. If the financial metric
indicates that the director is tracking toward spending more than the
budgeted amount, he is considered to be off target with his spending. In
each case, the KPI enables the producer to monitor the budget for the
show and take action if required.
KPIs can be complex, and
they aggregate data from multiple sources such as other KPIs. On the
other hand, they can be quite simple measures based on a single point of
data. The complexity or simplicity of a KPI depends on business needs
and requirements.
Creating an Analysis
Services KPI
In this example, you create a KPI
that tracks the number of viewers per episode and compares this number
to a fixed target:
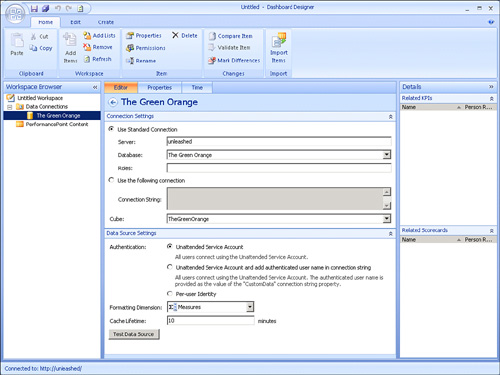
1. | Launch
Dashboard Designer and ensure that The Green
Orange Analysis Services data source is included in your
workspace, as shown in Figure 1.
|
2. | Open the
Create tab, and then click the KPI button to launch the Select a KPI
Template Wizard.
|
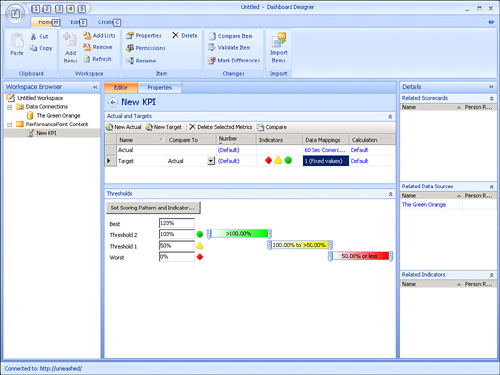
3. | Select
Blank KPI on the Select a KPI Template page in the wizard, as shown in Figure 2,
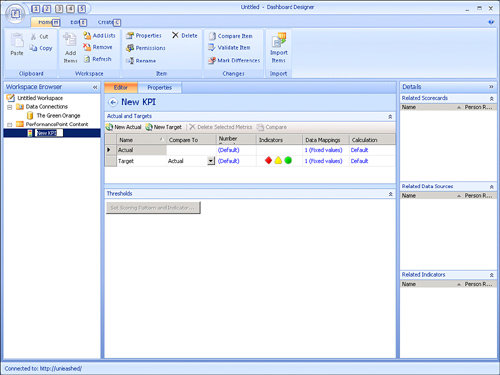
and then click OK. A KPI is created and the KPI editor appears in
Dashboard Designer (see Figure 3).
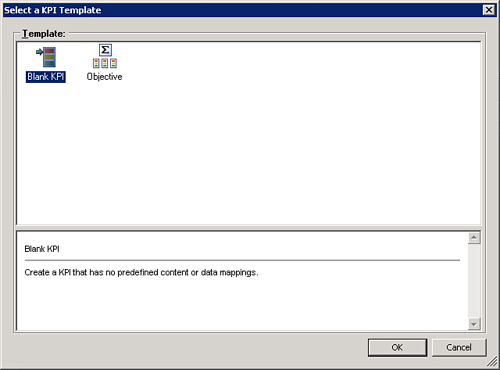
Note
A Blank KPI template
has no predefined content or data mappings. Data mappings will be added
after the KPI is created in step 5.
|
4. | To map the
actual value of the data source to The Green
Orange data source, click the 1 (Fixed Values) link at the
intersection of the Actual row and the Data Mappings column. The Data
Source Mapping dialog box appears.
|
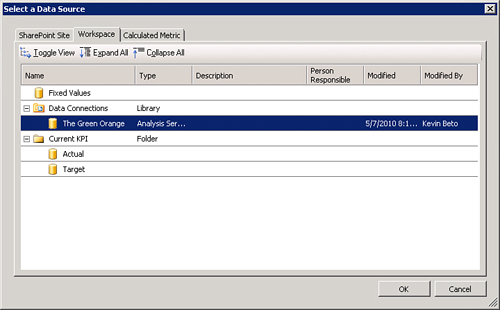
5. | Click the Change Source button at the bottom right of
the Source Mapping dialog. The Select a Data Source dialog box appears,
as shown in Figure 4.
|
6. | From the
Select a Data Source dialog box, find The
Green Orange data source, and then click OK.
|
7. | Now that The Green Orange
Data Source has been selected, you need to select a measure that you
want the KPI to display, as shown in Figure 5. To do this,
select the Viewers measure, and then click OK.
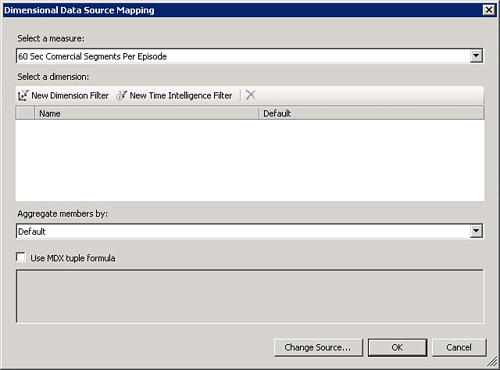
Note
There are other options you
can select, such as adding dimension filters, adding time intelligence
filters, and changing data source aggregation. You can also select a
custom Multidimensional Expressions (MDX) formula to represent the KPI.
MDX is a query language used for
online analytical processing (OLAP) databases. Within PPS, MDX is used
primarily for querying multidimensional data for cases where the PPS
dimension selection UI does not meet your needs.
MDX was more necessary in
PPS 2007 because the product lacked features such as dynamic hierarchy
selection that selects all children of a dimension member. For the most
part, these functionality gaps have been closed in the SharePoint 2010
release. Therefore, the MDX feature remains primarily for
backward-compatibility purposes.
|
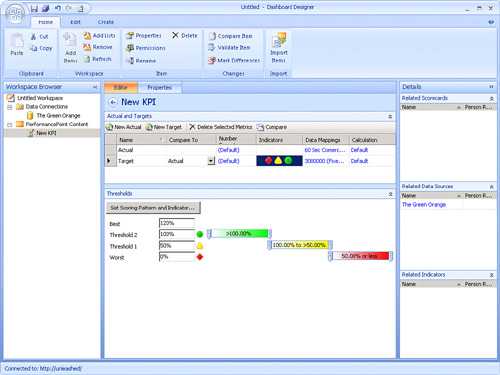
8. | At this
point, you have mapped the actual value to the KPI. Notice that the Data
Mappings field for the Actual row now displays your selections, as
shown in Figure 6. Next you need to set an appropriate target by clicking the 1
(Fixed Values) link at the intersection of the Target row and the Data
Mappings column.
|
9. | In the
Data Source Mapping dialog box, enter 30,000,000 as the fixed value you
are going to target for the Viewer KPI, and then click OK.
Note
It is possible to map actual
and target data to values that reside in different data sources. This
is especially useful in scenarios where target data is not formally
captured in a cube and it is necessary to provide target data from a
separate data source, such as a SharePoint list or Excel Services.
|
This completes the
process for configuring the KPI, shown in Figure 7. At this point, it is not possible to preview the
rendered KPI within the KPI editor. You see the values displayed from
the data source when the Viewer KPI is placed on a scorecard.
Note
The Properties tab is a shared tab
among all the different objects in the PPS world. From the Properties
tab, you can rename the object, change the folder path, or define custom
properties that can ultimately be displayed on a scorecard.
