Examining Data Mapping
Several different dialog
boxes and options are available for selecting the data you want to use
for a metric in a KPI, including the following:
Fixed value
Data sources
Existing metrics
Calculated metrics
Fixed Value
A fixed-value KPI is a
hard-coded numeric value. This is used primarily for setting a target
when you have a static target that is not stored in a data source.
For example, in The Green
Orange scenario, a fixed value might be
used to measure an average of critic rating of three stars or higher per
show. The number three for a target will not change, so using a static
or fixed value is appropriate.
This option always appears at
the top of the Workspace tab in the Select a Data Source dialog box.
Data Sources
It is also possible to
select any data source that PPS supports through the Date Source dialog
box. All data sources currently in the workspace that is loaded in
Dashboard Designer appear in the Workspace tab. If you want to pick a
data source that is not yet loaded in the workspace, the SharePoint Site
tab shows all data connection libraries that have been loaded in this
workspace. Choosing a data source from the SharePoint Site tab
automatically adds the selected data source to the current workspace.
Dimensional Data Source
Mapping Dialog Box
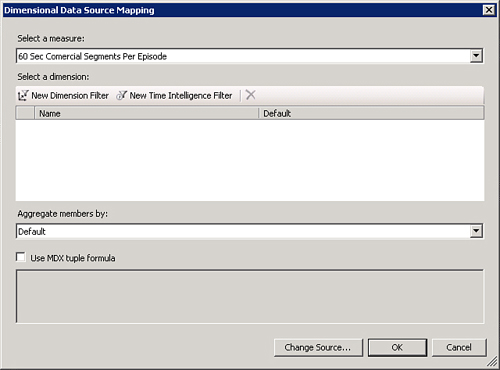
The standard way to create a
KPI involves mapping a measure from a data source to a KPI, as shown in Figure 10.
Note
Several levels of filtering
can occur on a scorecard. The first level of filtering, which can occur
at the KPI level, is accessible through the Dimensional Data Source
Mapping dialog box. Filtering can also happen at the level of the
scorecard or on the dashboard itself. This is also the order of
precedence. Filters placed on a KPI override any filters applied at a
higher level in the scorecard or on the dashboard. It is important to
note that placing filters at the KPI level is the least flexible option
for filtering KPIs.
Listed here are the
different options available when mapping data sources to metrics. Most
likely, you will not need to use all of them on each data mapping that
you do:
Select a Measure: Enables you to select a measure to use from the
cube or tabular data source. This is a required field.
New Dimension Filter: Enables you to filter on a specific dimension.
For example, in The Green Orange scenario, you can select to filter only on a
particular season or a particular episode.
New Time Intelligence
Filter: Enables you to enter a time
intelligence expression that will be used as a filter for the KPI.
Aggregate Members By: Enables you to override the aggregation used in
the cube for this metric. For example, you can change this option from
Default to Sum if you want this KPI to represent the total number of
60-second commercial segments per episode rather than the default
average.
Use
MDX Tuple Formula: This check box and associated edit box enable you
to enter your own custom MDX to represent this KPI.
Tip
MDX refers to a language in
which it is possible to select expressions from Analysis Services.
Because this is a complex language, it is recommended that you refer to Microsoft SQL
Server 2008 Analysis Services Unleashed (ISBN: 0672330016) for
in-depth information on this topic.
Existing Metrics
It is possible to copy the
settings from an existing metric from this KPI into the metric being
edited. For example, doing so proves useful when making a series of
similar metrics within a KPI. Instead of selecting all dimension filters
from scratch each time, this will create an identical copy that can be
edited independently of the source metric.
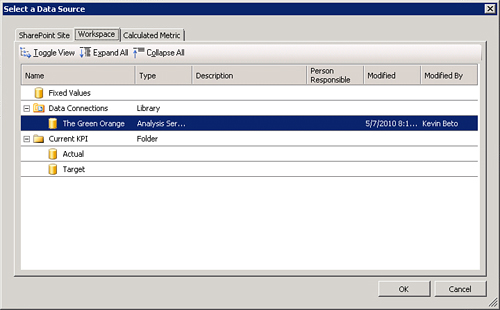
This option always appears
at the bottom of the Workspace tab of the Select a Data Source dialog
box, as shown in Figure 11.
This option enables you to select any existing metric within the
current KPI.
Caution
Keep in mind that the data is
copied one time only. This means that if the source metric changes, the
destination or copy of the metric will not automatically inherit changes
made to the source version.
Calculated
PPS
includes a sophisticated engine that allows for calculation and
manipulation of data. This is particularly useful if the data source you
are working with does not have the complete data set or structure
required for your metrics.
To access the
functionality for calculated metrics, open the Calculated Metric tab
from the Select a Data Source dialog, and then select a calculation
template. When you select a template, all the basic mathematical
operations are supported as well as some special functions.
The Calculated Metrics
Data Source Mapping dialog provides the following functionality (see Figure 12):
New Mapping and
Delete: Use these buttons to add or remove
mappings. Not all mappings need to be used in the formula field.
Mappings: This grid displays the current mappings for
the calculated KPI. It is possible to rename existing mappings here.
Click the Source link to select a new mapping, which may include another
calculated KPI.
Formula: You can
enter any mathematical formula you want for the calculated KPI in the
Formula edit box. All standard mathematical functions (+, -, *, /) and
parenthesis are accepted in this edit box. The special functions listed
in Table 1 are also accepted in the Formula edit box.
Table 1. Special Functions for Calculated
Metrics
| Function | Example Syntax | Description |
|---|
| Sum | Sum(val1,val2,val3) | Sums all the specified comma-delimited values. |
| Average | Average(val1,val2,val3) | Averages (via arithmetic mean) all the specified
comma-delimited values. |
| Min | Min(val1,val2,val3) | Returns
the minimum value of the collection of specified comma-delimited
values. |
| Max | Max(val1,val2,val3) | Returns the maximum value of the collection of specified
comma-delimited values. |
| Round | Round(20.333,1) | Rounds
the number to the specified number of decimal places. Zero decimal
places. |
| If | If(val1<=100,val2,100) | Similar
in functionality to the If
statement in Microsoft Excel. If the condition specified in the first
part of the expression is true, the second parameter is used. Otherwise,
the last parameter is used. |
| Abs | Abs(val1) | Returns the absolute
value of the value specified. |
Disable Scorecard Filters
for this Metric: Use this option to
prevent filters from affecting any of the values mapped for the
calculated KPI. This is useful if you do not want the metric to be
affected by any filter settings that the user may set on the dashboard
rendered in SharePoint.
Change Source: This button offers the ability to change the
KPI from a calculated metric to another type of data source, which, in
effect, cancels the calculated metric functionality.
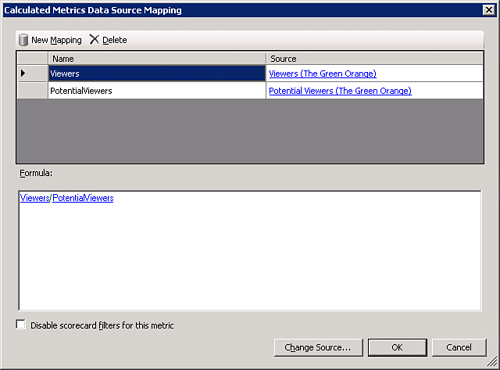
Table 1
lists the special functions that can be entered in the Formula edit box
when creating calculated metrics.
The following are examples of
useful calculations:
Setting null
values to 0: This expression is useful
when cleaning the data values of a data source. It is possible to take
places in the data source where no data is specified and display a zero
instead of an empty cell.
If(value<1000, null, value)
Setting
values under a certain amount to null:
This expression is helpful when filtering out values under a certain
threshold. In this example, all values under 1,000 will be given a null
value rather than their true value. If used in conjunction with the
scorecard setting of filtering out null values, it has the effect of
filtering out values below the specified threshold.
Number Formatting
The Format Numbers dialog box, shown in Figure 13, is accessible by clicking the link in the
Number Formatting column on the KPI metric that you want to edit. The
Format Numbers dialog box offers several self-explanatory options.
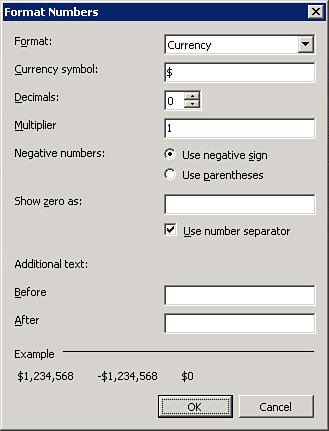
By default, PPS uses
formatting from the data source and passes the current viewers regional
settings down to the data source. For example, if the data source is
Analysis Services and a scorecard viewer on an Italian browser views the
scorecard, the number format will be represented in the European number
format 1.000,00 rather than the U.S. number format 1,000.00. To
homogenize the appearance for all scorecard viewers regardless of
regional settings, set the values in the Format Number dialog box. Only
change the settings in this dialog box if you want a uniform appearance
for all other cultures that will be viewing the scorecard.
Calculation
The Calculation dialog box,
shown in Figure 14, accessible by the link in the
Calculation column, affects the rollup behavior of KPIs in a scorecard.
Rollup behavior refers to how child KPIs are aggregated up to a parent
level. For example, there might be one “show success” KPI that is a
combination of several other KPIs such as popularity, revenue, and
production cost. The calculation dialog controls how these child KPI
values are aggregated up to the parent.
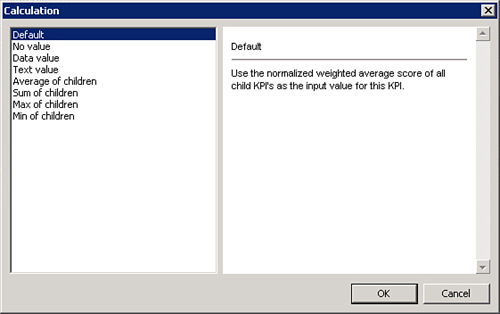
The settings in this dialog
box do not apply if the KPI is leaf level on a scorecard. This means
that the KPI has no child KPIs underneath it. If this is the case, all
options except default and source data return empty results.
The settings in this dialog
box do apply if the KPI is not at the leaf level of the scorecard, which
means there is at least one KPI placed underneath it. This is useful in
the case where you would like to compare the values of the child KPIs
instead of the scores. It is important to note that in this case, the
KPI will be ignored unless the aggregation is set to default or source
data of the actual value.
The Use Calculated Values of
Actual and Target to Compute Score check box appears only if the KPI
metric calculation being edited is a target KPI. Clearing this check box
creates an objective KPI. An objective KPI has no value. This is useful
in the case where you would like to compare the scores of child KPIs
rather than the values.
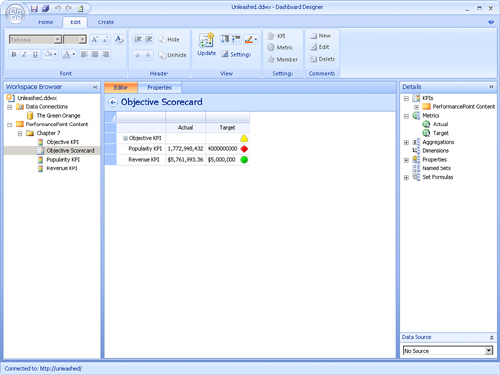
Note
The difference between an
objective KPI and a standard or nonobjective KPI is that objective KPIs
use only the calculated score of child KPIs, whereas standard KPIs
operate over values of child KPIs. An example of this, shown in Figure 15, shows how two different measures, one on show
viewers and the other on revenue, can be combined into a single metric.
Note
Objective KPIs are useful
in balanced scorecard scenarios when multiple and different types of
metrics are compared. For example, if you want to reconcile your
customer perspective and have several metrics from customer
satisfaction, retention rate, and support costs per customer, an
objective KPI will take the scores of each metrics and aggregate them to
provide an overall perspective of how that segment of the business is
running.
A standard KPI is useful when
aggregating several of the same type of metrics such as an overall
revenue amount for a division. If one KPI slightly outperforms against a
large forecast, and one KPI grossly underperforms on a small forecast,
the aggregate might be considered a good overall performance for that
division. Aggregating this by score through an objective KPI will show
that this division is performing poorly.
