Logo
programming4us
programming4us
programming4us
programming4us
Home
programming4us
XP
programming4us
Windows Vista
programming4us
Windows 7
programming4us
Windows Azure
programming4us
Windows Server
programming4us
Windows Phone
 
Windows Server

SharePoint 2010 PerformancePoint Services : Understanding and Working with KPIs (part 2) - Understanding Multiple Targets and Actuals

- Free product key for windows 10
- Free Product Key for Microsoft office 365
- Malwarebytes Premium 3.7.1 Serial Keys (LifeTime) 2019
3/27/2011 9:32:59 PM

Understanding Multiple Targets and Actuals

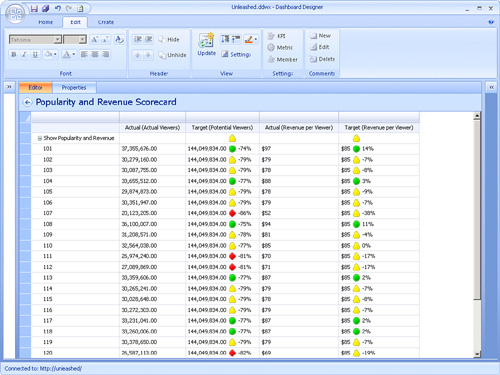
With PPS 2010, you can define multiple metrics in a single KPI. Doing so proves particularly useful when defining KPIs that have multiple success factors associated with them. In The Green Orange example, the producers want to know both the popularity of the show, measured in viewers, and the revenue earned per viewer, shown in Figure 8. The producers also want to view this on the same scorecard, as shown in Figure 9.

  • Actual (Actual Viewers): The total number of viewers that see each show. This metric comes directly from cube data.

  • Actual (License Fee): A value contained within the cube that indicates how much incoming revenue comes from the affiliate stations broadcasting each episode. This metric is not shown on the final scorecard.

  • Actual (Revenue per Viewer): A calculated metric determined by dividing the total number of viewers by the fees collected from the affiliates broadcasting the show.

  • Target (Potential Viewers): A value contained within the data source indicating the total number of potential viewers for the show. This is compared to the Actual (Actual Viewers) metric.

  • Actual (Revenue per Viewer): There is no metric in the cube for this value, so it is implemented as a fixed value with the goal of making about $85 per viewer. This is compared to the Actual (Revenue per Viewer) metric.
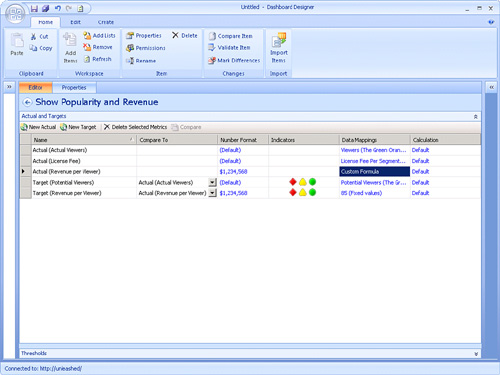
Figure 8. Multiple actuals and targets defined for a single KPI.

Figure 9. Scorecard with multiple actuals and targets shown.

With the KPI editor, you can create multiple metrics in a single KPI. This is useful when there is a KPI that may have multiple actual values such as products sold and products in inventory. These multiple values would be compared against multiple target values either on the same or different scorecards.

This functionality can be accessed by clicking the New Actual or New Target buttons in the KPI toolbar. The Compare To column for target metrics controls which actual metric will be used in scoring calculations for that target value.

Other -----------------
- SharePoint 2010 PerformancePoint Services : Understanding and Working with Indicators
- Exchange Server 2010 : Using Outlook to Send and Receive Digitally Signed and Encrypted Emails (part 2)
- Exchange Server 2010 : Using Outlook to Send and Receive Digitally Signed and Encrypted Emails (part 1)
- Implementing Secured Email Communications with Exchange Server 2010 (part 2)
- Implementing Secured Email Communications with Exchange Server 2010 (part 1) - Configuring Exchange Server User Certificates Using Autoenrollment
- Server Certificates in Exchange Server 2010
- Governing the SharePoint 2010 Ecosystem : Creating the Governance Plan (part 2) - Visually Mapping the Governance Strategy & Defining Governance Roles and Responsibilities
- Governing the SharePoint 2010 Ecosystem : Creating the Governance Plan (part 1) - Reviewing the Vision and Scope Documents
- Creating a Reusable Workflow from SharePoint Designer 2010
- Verifying the Web Application Settings for SharePoint Designer 2010 Use
 
 
Top 10
- Microsoft Visio 2013 : Adding Structure to Your Diagrams - Finding containers and lists in Visio (part 2) - Wireframes,Legends
- Microsoft Visio 2013 : Adding Structure to Your Diagrams - Finding containers and lists in Visio (part 1) - Swimlanes
- Microsoft Visio 2013 : Adding Structure to Your Diagrams - Formatting and sizing lists
- Microsoft Visio 2013 : Adding Structure to Your Diagrams - Adding shapes to lists
- Microsoft Visio 2013 : Adding Structure to Your Diagrams - Sizing containers
- Microsoft Access 2010 : Control Properties and Why to Use Them (part 3) - The Other Properties of a Control
- Microsoft Access 2010 : Control Properties and Why to Use Them (part 2) - The Data Properties of a Control
- Microsoft Access 2010 : Control Properties and Why to Use Them (part 1) - The Format Properties of a Control
- Microsoft Access 2010 : Form Properties and Why Should You Use Them - Working with the Properties Window
- Microsoft Visio 2013 : Using the Organization Chart Wizard with new data
 
programming4us
Windows Vista
programming4us
Windows 7
programming4us
Windows Azure
programming4us
Windows Server