OpsMgr
is primarily composed of five basic components: the operations
database, reporting database, Root Management Server, management agents,
and Operations Console. These components make up a basic deployment
scenario. Several optional components are also described in the
following bulleted list; these components provide functionality for
advanced deployment scenarios.
OpsMgr was specifically
designed to be scalable and can subsequently be configured to meet the
needs of any size company. This flexibility stems from the fact that all
OpsMgr components can either reside on one server or can be distributed
across multiple servers.
Each of these
various components provides specific OpsMgr functionality. OpsMgr design
scenarios often involve the separation of parts of these components
onto multiple servers. For example, the database components can be
delegated to a dedicated server, and the management server can reside on
a second server.
The following list describes the different OpsMgr components:
Operations database—
The operations database stores the monitoring rules and the active data
collected from monitored systems. This database has a 7-day default
retention period.
Reporting database— The reporting database stores archived data for reporting purposes. This database has a 400-day default retention period.
Root Management Server—
This is the first management server in the management group. This
server runs the software development kit (SDK) and Configuration service
and is responsible for handling console communication, calculating the
health of the environment, and determining what rules should be applied
to each agent.
Management server—
Optionally, an additional management server can be added for redundancy
and scalability. Agents communicate with the management server to
deliver operational data and pull down new monitoring rules.
Management agents—
Agents are installed on each managed system to provide efficient
monitoring of local components. Almost all communication is initiated
from the agent with the exception of the actual agent installation and
specific tasks run from the Operations Console. Agentless monitoring is
also available with a reduction of functionality and environmental
scalability.
Operations Console—
The Operations Console is used to monitor systems, run tasks, configure
environmental settings, set author rules, subscribe to alerts, and
generate and subscribe to reports.
Web console— The Web console is an optional component used to monitor systems, run tasks, and manage maintenance mode from a web browser.
Audit Collection Services— This
is an optional component used to collect security events from managed
systems; this component is composed of a forwarder on the agent that
sends all security events, a collector on the management server that
receives events from managed systems, and a special database used to
store the collected security data for auditing, reporting, and forensic
analysis.
Gateway server—
This optional component provides mutual authentication through
certificates for non-trusted systems in remote domains or workgroups.
Command shell— This optional component is built on PowerShell and provides full command-line management of the OpsMgr environment.
Agentless Exception Monitoring—
This component can be used to monitor Windows and application crash
data throughout the environment and provides insight into the health of
the productivity applications across workstations and servers.
Connector Framework—
This optional component provides a bidirectional web service for
communicating, extending, and integrating the environment with
third-party or custom systems.
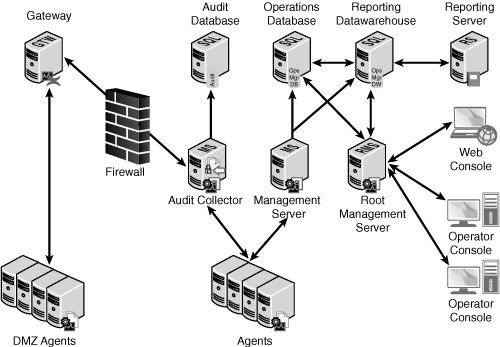
The Operations Manager 2007 architecture is shown in Figure 1, with all the major components and their data paths.

Understanding How OpsMgr Stores Captured Data
OpsMgr
itself utilizes two Microsoft SQL Server databases for all collected
data. Both databases are automatically maintained through
OpsMgr-specific scheduled maintenance tasks.
The operations
database stores all the monitoring rules and is imported by management
packs and operational data collected from each monitored system. Data in
this database is retained for 7 days by default. Data retention for the
operations database is lower than the reporting database to improve
efficiency of the environment. This database must be installed as a
separate component from OpsMgr but can physically reside on the same
server, if needed.
The reporting database
stores data for long-term trend analysis and is designed to grow much
larger than the operations database. Data in the reporting database is
stored in three states: raw data, hourly summary, and daily summary. The
raw data is only stored for 14 days, whereas both daily and hourly data
are stored for 400 days. This automatic summarization of data allows
for reports that span days or months to be generated very quickly.
Determining the Role of Agents in System Monitoring
The agents are the
monitoring components installed on each managed computer. They monitor
the system based on the rules and business logic defined in each of the
management packs. Management packs are dynamically applied to agents
based on the different discovery rules included with each management
pack.
Defining Management Groups
OpsMgr utilizes the
concept of management groups to logically separate geographical and
organizational boundaries. Management groups allow you to scale the size
of OpsMgr architecture or politically organize the administration of
OpsMgr.
At a minimum, each management group consists of the following components:
OpsMgr can be scaled
to meet the needs of different sized organizations. For small
organizations, all the OpsMgr components can be installed on one server
with a single management group. In large organizations, on the other
hand, the distribution of OpsMgr components to separate servers allows
the organizations to customize and scale their OpsMgr architecture.
Multiple management groups provide load balancing and fault tolerance
within the OpsMgr infrastructure. Organizations can set up multiple
management servers at strategic locations, to distribute the workload
among them.
Note
The
general rule of thumb with management groups is to start with a single
management group and add on more management groups only if they are
absolutely necessary. Administrative overhead is reduced, and there is
less need to re-create rules and perform other redundant tasks with
fewer management groups.