The Reliability and Performance Monitor is
new in Windows Vista and provides new features as well as improvements
to existing features. The key objective of the Reliability and
Performance Monitor in Windows Vista is to provide an interface that
makes it easier for users to visually find and isolate the cause of
performance problems rather than just obtain and view performance data.
The Windows Vista Reliability and Performance Monitor contains the following components:
Resource Overview
Performance Monitor
Reliability Monitor
Data Collector Sets
Reports
1. Component Binaries
The Reliability and Performance Monitor is a
Microsoft Management Console (MMC) snap-in that is implemented in
perfmon.msc. The following component-specific binaries are loaded when
you start the Reliability and Performance Monitor MMC:
pdh.dll Used to interact with various performance counter sources
pdhui.dll Provides the new Add Counter dialog boxes (formerly in pdh.dll)
pla.dll Determines if the user has permission to view/modify performance data and allows programmatic logging of performance data
perfctrs.dll Acts as a performance counters interface
perfdisk.dll Acts as a disk performance object interface
relmon.dll Reliability Monitor
tdh.dll Event Trace Helper
wdc.dll Includes all Perfmon user interface elements
2. Opening the Reliability and Performance Monitor
You can open the Reliability and Performance Monitor by using any of the following methods:
- Open the Computer Management console (compmgmt.msc), expand System Tools, and click Reliability and Performance
- From within Administrative Tools open the Reliability and Performance Monitor
- Add the Reliability and Performance Monitor snap-in to a Microsoft Management Console (MMC).
- Type perfmon.exe or perfmon.msc and press Enter at the Start menu.
You can also open the Resource Overview and
Performance Monitor alone from the command prompt without opening the
Reliability and Performance Monitor as follows:
Type perfmon /sys to launch Reliability and Performance Monitor in standalone Performance Monitor mode (formerly System Monitor).
Type perfmon /report
to launch Reliability and Peformance Monitor in a standalone window,
run the Diagnosis report for 60 seconds, and display the resulting
report (new for Windows Vista).
Type perfmon /rel to launch Reliability and Performance Monitor in standalone Reliability Monitor mode (new for Windows Vista).
Type perfmon /res to launch Reliability and Peformance Monitor in standalone Resource Monitor mode (new for Windows Vista).
To open Reliability Monitor outside of the
Reliability and Performance Monitor, you can add the Reliability Monitor
snap-in to a MMC console.
Note
When you open the Resource Overview using /res or Performance Monitor using /sys,
these components are hosted in perfmon.exe rather than in mmc.exe. The
parent window for Resource Overview is titled Resource Monitor when you
open it with the command perfmon /res.
In addition, Performance Monitor no longer supports collecting data
from Windows Management Instrumentation (WMI), so the command perfmon /wmi is no longer supported. |
3. Using Resource Overview
When you open the Reliability and Performance
Monitor, the Performance Diagnostics node is highlighted by default and
the new Resource Overview is displayed in the main MMC pane as shown in Figure 1.
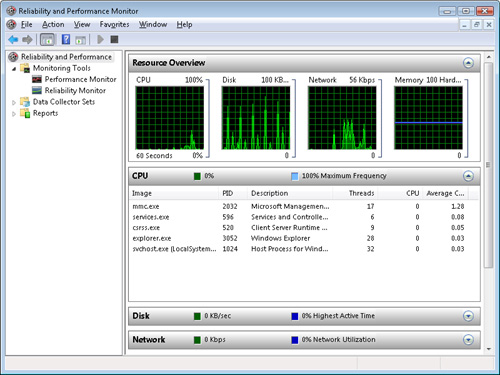
The Resource Overview provides a resource utilization summary for the four main performance metrics:
Four scrolling graphs in the Resource Overview
pane display the real-time resource usage in one-second intervals.
Beneath the scrolling graphs are four expandable sections that provide
more granular detail about each resource. You can expand the details
sections to show more resource information by clicking the resource
graph or by clicking the down arrow on the right side of the desired
details section.
The Resource Overview is implemented in wdc.dll
and is hosted in either an MMC console (mmc.exe) or perfmon.exe,
depending upon the method that you use to start the component. Resource
Overview components are discussed in more detail in the following
sections.
Note
You can use the Resource
Overview to monitor resources only on the local computer. You cannot
obtain Resource Overview information for a remote computer. |
CPU Graph
The CPU graph shows the overall CPU
utilization. The expandable CPU details section shows the per-process
CPU utilization along with a mini graph that displays the current CPU
usage. The CPU details section (shown in Figure 22-1) includes the following information:
Image The application using CPU resources
PID The process ID of the application instance
Threads The number of threads currently active from the application instance
CPU The CPU cycles currently active from the application instance
Average CPU
The average CPU load resulting from the application instance, expressed
as a percentage of the computer’s total processing capacity
Disk Graph
The Disk graph displays the total current disk
I/O rate. The expandable Disk section shows the per-process disk
utilization along with a mini graph showing current total disk usage in
KB/sec. The Disk section includes the following information:
Image The application using disk resources
PID The process ID of the application instance
File The file being read and/or written by the application instance
Read The current speed (in bytes/min) at which data is being read from the file by the application instance
Write The current speed (in bytes/min) at which data is being written to the file by the application instance
IO Priority The priority of the I/O task for the application
Response Time The response time in milliseconds for the disk activity
Network Graph
The Network graph displays the current total
network traffic in kilobits per second (Kbps). The expandable Network
section shows the per-process network usage along with a mini graph
showing current network utilization. The Network section includes the
following information:
Image The application using network resources.
PID The process ID of the application instance.
Address
The network address with which the local computer is exchanging
information. This may be expressed as a computer name when referring to
other computers on the same local area network, an IP address, or a
hostname.
Send The amount of data (in bytes per minute) the application instance is currently sending from the local computer to the address.
Receive The amount of data (in bytes per minute) the application instance is currently receiving from the address.
Total The total bandwidth (in bytes per minute) currently being sent and received by the application instance.
Memory Graph
The Memory graph displays the current hard
faults per second and the percentage of physical memory currently in
use. The expandable Memory section shows the per-process memory usage
and two mini graphs showing hard page faults per second and the
percentage of physical memory in use. The Memory section includes the
following information:
Image The application using memory resources
PID The process ID of the application instance
Hard Faults/min The number of hard faults per minute resulting from the process instance
Commit The amount of memory committed by the process
Working Set The amount of physical memory, in KB, currently in use by the process instance
Shareable The current size of memory, in KB, that a process has allocated and that can be shared with other processes
Private The current size of memory, in KB, that a process has allocated and that cannot be shared with other processes
Note
Hard page
faults are a better indicator of memory starvation than soft page
faults. A hard page fault occurs when the referenced memory page is no
longer in physical memory and has been paged to the disk. A hard page
fault is not an error, but it can indicate that more memory is needed to
provide optimal performance. |
