Comparing Performance Monitor Logs
You can use System Monitor’s new Compare
feature to overlay multiple log files for comparison. This feature is
most useful for comparing multiple log files that have been configured
to log the same data points for the same amount of time. To access the
Compare feature, you must start Performance Monitor with the /sys
parameter (perfmon /sys) from Run or from a command prompt. Once
Performance Monitor is open, you can view and compare log files as
illustrated by the following steps:
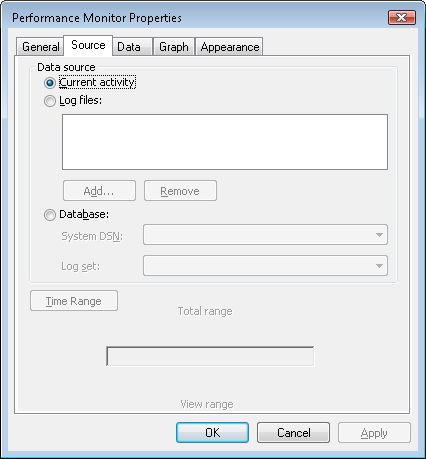
1. | To open the first log file, click the cylinder on the toolbar to open the System Monitor Properties dialog box.

|
2. | Click the Log files radio button and then click Add to open the Select Log File window.
|
3. | Locate
the log file that you want to open and then click Open. The log file
will be added to the System Monitor instance but no counters will be
added by default.
|
4. | To
add the desired counters, click the plus sign on the toolbar to open
the Add Counters window. The counter data will be displayed in the main
System Monitor window.
|
5. | Repeat steps 1 through 3 to open the second log, by opening another Performance Monitor instance with the perfmon /sys command, and add the desired counters.
|
6. | After
you open the logs for comparison, two opaque Performance Monitor
windows will open on the desktop. Position and size the anchor
window—which may be any of the Performance Monitor logs being
compared—in the desired location. This will be the Performance Monitor
window upon which you overly the other windows.
|
7. | Select
the second Performance Monitor window—which will be overlaid on top of
the first window—to bring it into focus, click the Compare menu, point
to Set Transparency, and then select the desired transparency level.
Note that transparency here is not related to the Windows Vista Aero
Glass feature and works on systems that are not capable of supporting
Aero Glass.
The Set Transparency option sets the transparency of the window
to be overlaid on the anchor window. The transparency options are: No
Transparency, 40% Transparency, and 70% Transparency. When you set the
transparency to 40%, the desktop background remains visible through the
second window.
|
8. | Select the Compare menu item and then click the Snap To Compare option.
|
The second window is resized to the same size as the anchor window and is overlaid on top of the anchor window.
Note
You can still interact
with both Performance Monitor windows individually to change properties;
select menu items; and minimize, maximize, or close the windows. |
Performance Monitor User Rights
Performance Monitor user rights are specified as follows:
Administrator Local and remote full control
Performance Log Users Can access and log performance counter data locally and remotely (create, manipulate, and view logs)
Performance Monitor Users Can access performance counter data locally and remotely (view logs)
Note
On earlier versions of
Windows, Performance Monitor can be used to monitor Windows Vista
computers with options previously available on earlier versions of
Windows but without support for new Windows Vista features. The user of
the earlier version of Windows must also be in the local administrator
group on the Windows Vista computer. |
Managing Performance Logs and Event Trace Sessions with Logman
Logman.exe creates and manages Event Trace
Session and Performance logs and supports many functions of Performance
Monitor from the command line. Logman has been enhanced in Windows Vista
and uses the following syntax from an elevated command prompt:
logman [create | query | start | stop | delete| update | import | export | /?] [options]
Logman commands include the following:
logman create Creates a counter, trace, configuration data collector, or API
logman query Queries data collector properties
logman start | stop Starts or stops data collection
logman delete Deletes an existing data collector
logman update Updates the properties of an existing data collector
logman import | export Imports a data collector set from an XML file or exports a data collector set to an XML file
logman /? Displays help for logman
The following usage examples illustrate logman syntax.
logman create counter perf_log -c "\Processor(_Total)\% Processor Time"


									logman create trace trace_log -nb 16 256 -bs 64 -o c:\logfile


									logman start perf_log


									logman update perf_log -si 10 -f csv -v mmddhhmm


									logman update trace_log -p "Windows Kernel Trace" (disk,net)