5. Using Reliability Monitor
Reliability Monitor is a new MMC snap-in for
Windows Vista that provides a system stability overview and trend
analysis with detailed information about individual events that may
affect the overall stability of the system. Reliability Monitor begins
to collect data at the time of system installation. It then presents
that data in a chart format that administrators and users can utilize to
identify drivers, applications, or hardware that are causing stability
or reliability problems on the computer.
Reliability Monitor tracks the following categories of events:
Reliability Monitor Features
Reliability Monitor provides the following features:
Automatic Data Collection and Processing
Reliability
Monitor gathers and processes data with the Reliability Analysis
Component (RAC). Data is automatically collected by the reliability
analysis metrics calculation executable (racagent.exe), also known as
the RACAgent process. The RACAgent analyzes, aggregates, and correlates
user disruptions in the operating system, services, and programs, and
then processes the data into reliability metrics. The RACAgent runs as a
hidden scheduled task named RACAgent to collect specific events from
the event log. The RACAgent runs once every hour to collect relevant
event log data and processes data once every 24 hours, so stability data
will not be available immediately after installation.
After the data is collected, the RACAgent
processes this information using a weighted algorithm. The result of the
data processing is a stability index number that can vary on a scale
from 0 to 10, with 0 being the least reliable and 10 being the most
reliable. The reliability index and the results of the event tracing are
then displayed in the System Stability Chart, which you can view by
clicking Reliability Monitor in the Diagnostic Console.
|
The RACAgent is a hidden scheduled task that
is automatically configured during system installation. This task is
responsible for gathering the reliability data and displaying it in the
chart view. The RACAgent task typically runs once every hour and will
not wake the machine if it is sleeping. If the computer is a laptop on
battery power, RACAgent.exe will immediately exit if the battery
capacity is at less than 33 percent. To view the RACAgent task in Task
Scheduler, select RAC within the Task Scheduler library, and then
right-click and select View - Show Hidden Tasks in the MMC action pane.
If you do not want to track system stability,
you can disable the RACAgent task by selecting the Disable option,
which is accessible in any of the following ways when the RACAgent task
is highlighted in the main MMC pane:
Microsoft Global Technical Readiness Platforms Team
|
System Stability Chart
The top half of the Reliability Monitor window
contains the System Stability Chart and a calendar control that you can
use to select the time range to be viewed. A scroll bar at the bottom
of the graph allows you to move forward or backward in time to view the
stability history. Users will view the System Stability Chart to
identify one or more days when the stability index has decreased from a
previous level. Reliability Monitor maintains a year of history for
system stability and reliability events.
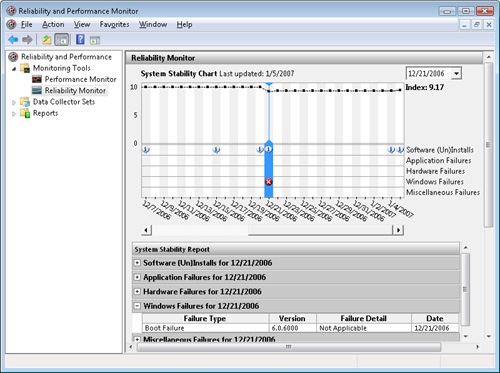
The Reliability Monitor information is
displayed in the System Stability Chart as data points that represent
the reliability index of the system for a specific day. If the system
clock is ever shifted significantly, the data point for that particular
day is replaced by a blue information icon. The x-axis displays the date
range and the y-axis displays the Stability Index number. The chart
also indicates, with a circular red error icon or a yellow warning icon,
if a failure occurred in one of the major categories on a given day.
You can access the failure details from the expandable items in the
System Stability Report section of the Reliability Monitor below the
chart. Figure 6 shows the System Stability Chart and Report section.
Stability Index
The Stability Index is the primary indicator
of system stability (or reliability) over time, based on the data that
has been gathered and processed by Reliability Monitor.
Reliability Monitor tracks the number of user
disruptions per day over a 28-day rolling window of time, with the
latest day of the rolling window being the current day. The Stability
Index algorithm processes the information and calculates the stability
index relative to the current day. Until the Reliability Monitor has
collected 28 days of data, the Stability Index is displayed as a dotted
line on the graph, indicating that it has not yet established a valid
baseline for the measurement. The Stability Index is represented as a
real number between 1.0 and 10.0, with 1.0 being the least stable and
10.0 being the most stable.
System Stability Report
After you select a day or date range, you can
view the report items for that day by using the expandable items in the
System Stability Report section. The report will specify the
application, driver, or other system component that is causing the drop
in the System Stability Index. This information helps you identify
changes in system state that may be causing decreased system stability.
Reports focus on the following categories:
The reports are sorted first by date in
descending order (most recent date first) and then by application or
driver name in ascending alphabetical order. The System Stability
Reports are based on specific event data gathered by the RACAgent.
Details for each event category are described in the following sections.
Software (Un)installs
This category tracks software installations,
updates, configuration changes, and removals including the operating
system, Windows updates, drivers, and applications. The report contains
the following information:
Software Operating system, name of application, Windows update name, or driver name
Version Version of the operating system, application, or driver (This field is not available for Windows updates.)
Activity Indicates the software change
Activity status Indicates success or failure for the action
Date The date of the action
The events that the RACAgent parses to generate the Software (Un)installs report are:
Application installation and removal: MsiInstaller 1033, 1034, 1035, 1036, 1037, 1038
Driver installation: User-PnP 20001
Driver removal: User-PnP 20002
Update installation and removal: Automatic Update / Windows Update 19, 20, 21, 23, 24 and SUS 183, 184, 190, 193, 194
Operating system upgrade, service pack, or hotfix: NTServicePack 4353, 4354, 4363
Note
User-PnP 20002 was not implemented for Windows Vista RTM and may be part of a future Microsoft Windows release. |
Application Failures
This category tracks application hangs
(including the termination of a non-responding application) and crashes.
The report contains the following information:
Application Executable program name of the application that hung or crashed
Version Version number of the application
Failure type Indicates whether the application failed as a result of a hang or crash
Date The date of the application failure
The events that the RACAgent parses to generate the Application Failures report are:
Hardware Failures
Disk (Disk Failure Diagnostic) and Memory
(Windows Memory Diagnostic) failures are tracked in this category. The
report contains the following information:
Component type Indicates whether the failure occurred on the hard drive or in memory
Device Identifies the device that is failing
Failure type
Indicates whether a hard drive failure resulted from a bad disk or a
bad block, or indicates that a memory failure resulted from bad memory
Date The date of the hardware failure
The events that the RACAgent parses to generate the Hardware Failures report are:
Windows Failures:
Operating system crashes, boot failures, and
sleep failures are tracked in this category. The report contains the
following information:
Failure type Indicates whether the event is a boot failure, OS crash, or sleep failure
Version Versions of the operating system and service pack
Details Possible failure details are:
OS crash Indicates the stop code for the crash
Boot failure Indicates the detected problem
Sleep failure Indicates the component veto or failure to enter hibernation
Date The date of the Windows failure
The events that the RACAgent parses to generate the Windows Failures report are:
System Clock Changes
This category displays information on any
significant clock changes that have occurred on the system. Information
on clock changes is only shown if the system has experienced at least
one significant clock change.
The event that will be parsed by the RACAgent to generate the System Clock Changes report is:
Miscellaneous Failures
This category displays information on any
shutdown that was unexpected or where the system does not have a record
of any user or process requesting system shutdown. The report contains
the following information:
Failure type Disruptive shutdown.
Version Version of the operating system and service pack.
Details The computer was not cleanly shut down.
Date Date of failure.
The event that the RACAgent parses to generate the Miscellaneous Failures report is:
Reliability Monitor Data Files
The data files that Reliability Monitor creates
and uses to determine the stability information are stored in the
following folders:
To reset Reliability Monitor to its default
state, where no stability information is displayed, delete all of the
files in these two folders. The files will be recreated with only
current stability information the next time the RACAgent scheduled task
runs.
The
data that Reliability Monitor presents in the default view as well as
the time-specific views is from HTML pages that Reliability Monitor
creates before displaying the particular view. Reliability Monitor
creates the HTML files, named Rmoxxxx.tmp.htm (where xxxx is a random number) in the Temp folder in the user’s profile folder:
\Users\<username>\AppData\Local\Temp
You can obtain this file for trend
analysis if desired; however, it will automatically be deleted when
Reliability Monitor is closed.
