3. Event Viewer User Interface
The Windows Vista Event
Viewer interface is new for Windows Vista and has many new features. The
Event Log service in Windows Vista introduces many more event logs and
event log types to the operating system. The increase in the number of
events, increased verbosity of events, and the dramatic increase in the
number of component-specific event logs necessitates a much more
intuitive user interface. The new Event Viewer contains powerful
filtering and view customization features, as well as many new actions
that can be performed on events or groups of events. The following
sections explain the new features of the Windows Vista Event Viewer.
Accessing Event Viewer
You can open Event Viewer by using either of the following methods:
- Click Start, then All Programs, then Administrative Tools, then click Event Viewer.
- Open
the Computer Management console by right-clicking Computer from the
Start menu and clicking Properties. Expand System Tools and click Event
Viewer.
- From Run or from a command prompt, type eventvwr.exe or eventvwr.msc.
- Add the Event Viewer MMC snap-in to an MMC console.
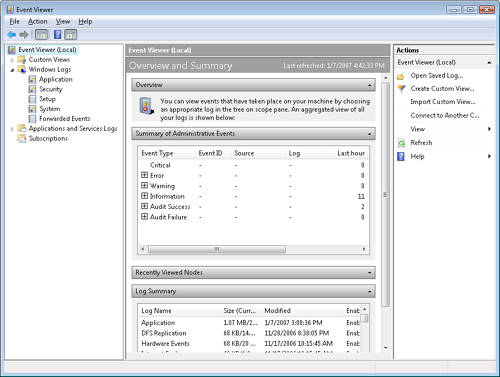
Figure 2 shows the default Event Viewer interface.
Overview And Summary View
The Event Viewer opens
to the Overview and Summary page showing all events across all Windows
Logs. The total number of events for each type that have occurred are
displayed, with additional columns that will display the number of
events of each type that have occurred over the last seven days, the
last 24 hours, or the last hour. Clicking on the + (plus) sign allows
you to drill-down into each event type and display the Event ID, Source,
and Log that the event occurred in. Double-clicking on a specific event
summary will take you directly to that event in the log and
automatically creates a filtered view, showing all individual events
with that event source and event ID, which can be accessed from the left
pane.
Note
The Summary page
includes events from all administrative logs, which includes both the
Windows Logs and any application-specific administrative logs if such
exist. |
Log Summary
When you scroll to the bottom of the Summary
page, a Log Summary is presented that lists the name of each event log
on the system, the current size and maximum size, the last modified
date, whether the log is enabled or disabled, and the retention policy.
Custom Views
You can configure and
persist event filters by using the Custom Views node in Event Viewer.
You can automatically create views by double-clicking events in the
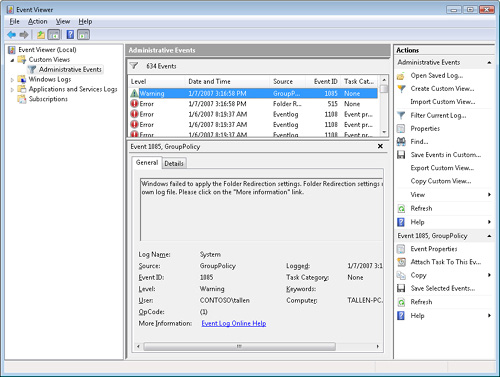
summary view, or you can create views manually. In Windows Vista, a
built-in custom view named Administrative Events shows all events on the
system that may require administrative action by filtering errors and
warnings across all admin logs on the system.
Create a view manually
To create a view (filter) manually, follow these steps:
1. | Right-click Custom Views and then select Create Custom View.
|
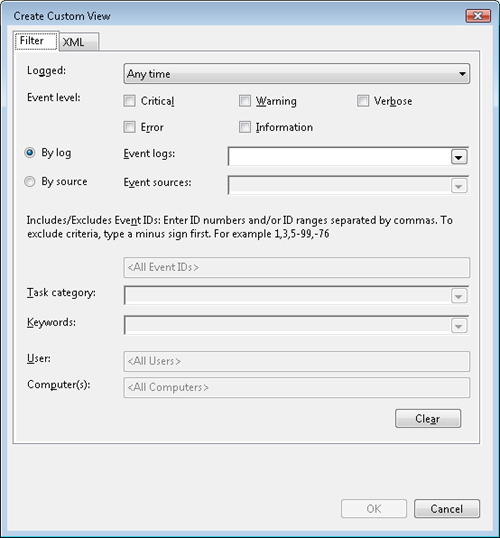
2. | In the Create Custom View window, enter the criteria for which you want events displayed.
Note You can also click
the XML tab and enter the XML filter directly. This may be useful if you
are creating an advanced query for which the GUI options in the Filter
tab are insufficient. Note that once you edit a filter in the XML tab,
you cannot return to the Filter tab for that filter. |
|
3. | Select the fields used to filter events, using the following criteria:
- By Log If you are
filtering by log, you select first the logs you are interested in, and
the sources drop-down adjusts to just the sources available in those
logs.
- By Source If
you are filtering by source, you pick the sources of interest first, and
the event logs drop-down adjusts to the list of logs relevant for those
sources.
- Logged Last
Hour, Last 12 Hours, Last 24 Hours, Last 7 Days, or Last 30 Days.
Selecting Custom Range brings up the Custom Range dialog box, allowing
you to select a much more specific date range, including when events
start and when they stop.
- Event Level Select Critical, Warning, Verbose, Error, or Information.
- Event Logs
Click the drop-down arrow to open the event log selection window.
Select the event log or event logs that you want to include in the view.
- Event Sources
Click the drop-down to display a list of available sources for the
selected log so you can specify which event source(s) to include in the
view. In some cases certain sources may not be listed (usually this may
happen for legacy sources), in which case you can type in the source
name manually.
- Include/Exclude Event IDs
Enter Event ID numbers or ranges to be included or excluded, separated
by commas. To exclude, enter a minus sign in front of the number. For
example, entering 1,3,5-99,-76 will include event ID’s 1,3,5 through 99,
and exclude 76.
- Task Category Select a task category to filter for events which specify that task category.
- Keywords Enter task keywords to be included in the filter.
- User Enter the user name by which to filter the events.
- Computer
Enter the computer name by which to filter events. This will likely be
used when filtering saved logs from different other machines, or when
filtering events forwarded from several machines on to a centralized
log.
|
4. | Click
OK, name the View, and then select where the view will be saved. Create
a new folder, if needed, to better categorize your custom views you
create for various purposes. By default, custom views defined on a
machine will be available to all users on that machine. To define a
custom view private to the current user, uncheck the All Users checkbox
before saving the view. Custom Views are saved and you may reuse them
any time you run Event Viewer in the future. Furthermore, custom views
can also be exported into an XML file at a specified location, or
imported from an XML file. This allows administrators to share
interesting event views by exporting them to a shared location and
importing into various Event Viewer consoles as needed.
|
Figure 3 shows the default Administrative Events custom view.
Windows Logs
The Application,
System, Security, and Setup logs are now located under the Windows Logs
node in the Event Viewer tree view. An event summary view including the
name, type, number of events, and size of each log is displayed when
this node is selected. Events in a log may be viewed by selecting the
log you wish to view in the left pane.
Applications and Services Logs
Hardware Events, Internet Explorer, and other
Windows components and applications events are accessible under the
Applications and Services Logs node. Applications and Services logs are a
new category of event logs that store events from a single application
or component rather than events that might have system-wide impact.
Normally, available application or service logs will be listed in a
hierarch under the manufacturer and product name. (Some event providers
which do not follow the naming convention that allows such
categorization may show up directly under the Applications And Services
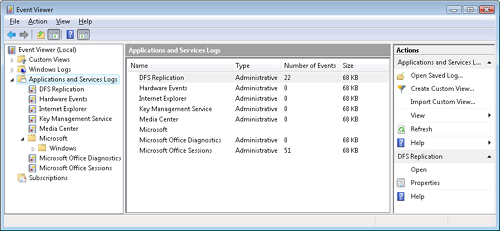
node). A summary view including the name, type, number of events, and
size of each log is displayed when the Applications and Services node,
or any sub-node that contains logs, is selected in the Event Viewer tree
view as shown in Figure 4.
Note
If other applications
are installed, such as 2007 Microsoft Office applications, additional
Applications and Services Logs may be displayed as shown in Figure 4. |
This category of logs includes four subtypes:
Admin, Operational, Analytic (trace), and Debug logs. Events in Admin
logs are of particular interest to IT professionals who use Event Viewer
to troubleshoot problems, because events in the Admin log provide
guidance on how to respond to the event. Events in the Operational log
are also useful for IT professionals, but sometimes require more
interpretation.
Analytic and Debug logs are not as
user-friendly, and are mostly oriented to be used by tools or advanced
administrators and developers. Analytic logs store events that trace an
issue and, often, a high volume of events are logged. Debug logs are
used by developers when debugging applications. Both Analytic and Debug
logs are hidden by default. If you will be working with these types of
logs and want to see them in the Event Viewer, select the Show Analytic
and Debug Logs menu option from the View item on the action pane. Then,
to turn on/off logging into a particular analytic or debug log, select
the log of interest and click “Enable Log” or “Disable Log” in the
Actions pane. Alternatively, Analytic and Debug logs can also be
enabled/disabled by typing wevtutil sl logname /e:true at an elevated command prompt. For more information concerning wevtuti.exe, see the sidebar “How It Works: The Windows Events Command Line Utility.”
Caution
When you enable Analytic
(trace) and Debug logs, they usually generate a large number of
entries. For this reason, you should only enable them for a specified
period to gather troubleshooting data, and then turn them off to reduce
the associated overhead. |
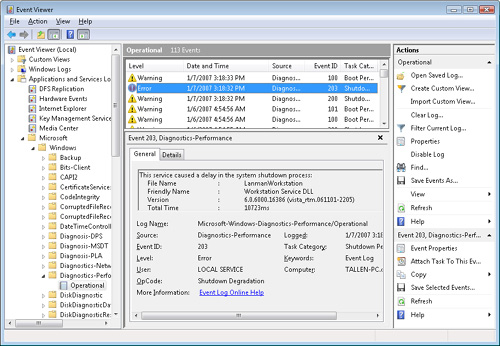
You can view events by highlighting the log you
want to view in the left pane. Most Microsoft components that have
their own channel in Windows Vista are displayed under the Microsoft section, as shown in Figure 5.
(This is true for all events whose publishers follow the
<manufacturer>-<product>-<publisher> naming convention
described previously.)
|
The Windows Events Command Line Utility
(wevtutil.exe) lets you retrieve information about event logs and
publishers, install and uninstall event manifests, run queries, and
export, archive and clear logs from an elevated command prompt. The
usage for this command described below. Note that you can use either the
short (i.e. ep /uni) or long (i.e. enum-publishers /unicode) version of
the command and option names, and all commands, options and option
values are case-insensitive.
The generally syntax for wevtutil.exe is as follows:
wevtutil command [argument [argument] ...] [/option:value [/option:value] ...]
Here command can be any of the following:
al (archive-log) Archives an exported log. cl (clear-log) Clears a log. el (enum-logs) Lists log names. ep (enum-publishers) Lists event publishers. epl (export-log) Exports a log. gl (get-log) Gets log configuration information. gli (get-log-info) Gets log status information. gp (get-publisher) Gets publisher configuration information. im (install-manifest) Installs event publishers and logs from manifest. qe (query-events) Queries events from a log or log file. sl (set-log) Modifies configuration of a log. um (uninstall-manifest) Uninstalls event publishers and logs from manifest.
Common options are as follows:
/r:value (remote) If specified, runs the command on a remote computer named value. Note that im (install-manifest) and um (uninstall-manifest) do not support remote operation. /u:value (username) Specifies a different user to log on to remote computer. Here value is a user name in the form domain\user or user. This option is only applicable when option /r (remote) is specified. /p: value (password) Specifies a [assword for the specified user. If not specified or value is “*”, the user will be prompted to enter a password. This option is only applicable when /u (username) option is specified. /a:value (authentication) Specifies an authentication type for connecting to a remote computer. Value can be Default, Negotiate, Kerberos or NTLM. The efault is Negotiate. /uni:value (unicode) Displays output in Unicode. Value can be true or false (if true then output is in Unicode).
To learn more about a specific command, type wevtutil command /? at an elevated command prompt.
|
Saving and Opening Event Logs
You can use Event
Viewer to save events and open saved event logs for archiving and
analysis purposes. The context menu options here are as follows:
Save Events As
Save the selected channel (log file) in one of the following formats:
Event Files (.evtx) (the default)
XML (XML File) (.xml)
Text (Tab delimited) (.txt)
CSV (Comma separated) (.csv)
Open Saved Log
Open the saved events to display them in Event Viewer. The supported formats are:
Event Log Files (.evtx, .evt, .etl) (the default)
Event Files (.evtx)
Legacy Event Files (.evt)
Trace Log Files (.etl)
These actions are commonly used by
administrators and support individuals to troubleshoot problems on
computers where a direct live connection is not available.
Subscriptions
Using Event Viewer, you can view events on a
single remote computer. However, troubleshooting an issue might require
you to examine a set of events stored in multiple logs on multiple
computers.
Windows Vista includes the ability to collect
copies of events from multiple remote computers and store them locally.
To specify which events to collect, you create an event subscription.
Among other details, the subscription specifies exactly which events
will be collected and in which log they will be stored locally. Once a
subscription is active and events are being collected, you can view and
manipulate these forwarded events as you would any other locally stored
events.
Using the event-collecting feature requires
that you configure both the forwarding and the collecting computers. The
functionality depends on the Windows Remote Management (WinRM) service
and the Windows Event Collector (Wecsvc) service. The WinRM service must
be running on both computers participating in the forwarding and
collecting process. The Wecsvc service only needs to be running on the
collecting machine since on the source machine there is a forwarding
plug-in that runs in-process to WinRM.
To define a subscription, you must be
administrator on the collector machine. As part of the subscription
definition, you define what security context should be used when
accessing the logs on the source machines. This can be either a specific
user account, or the collector machine account. The specified account
must have read access to the logs on the source machines that are
participating in the subscription. One way to set this up is to use a
new built-in group called Event Log Readers, to which you can add any
accounts you want to give access to reading logs.
To configure computers to forward and collect events, follow these steps:
1. | Log
on to all collector and source computers. If the computers are members
of a domain, it is a best practice to use a domain account with
administrative privileges.
|
2. | On each source computer, type winrm quickconfig
at an elevated command prompt. When prompted, confirm that the changes
should be made. To skip the prompt (for example, if you are using this
command in a script), add the –q parameter.
|
3. | On the collector computer, type wecutil qc
at an elevated command prompt. (If you use Event Viewer, this will be
done automatically for you on the collector.) When prompted, confirm
that the changes should be made. To skip the prompt, add the /q:true parameter.
|
4. | Add
the computer account of the collector computer to the Event Log Readers
group on each of the source computers if you will be using the computer
account as the account to be used when collecting events. The advantage
of using the collector computer account is that you don’t need to deal
with expiring passwords. However, if you do use a specific user account,
you will need to add that account to the Event Log Readers instead of
the collector machine account.
|
Note
By default, the Local
Users And Groups MMC snap-in does not allow you to add computer
accounts. In the Select Users, Computers, Or Groups dialog box, click
Object Types and then select the Computers check box. You will now be
able to add computer accounts. |
Additional Considerations
In a workgroup environment, you can follow the
same basic procedure described in the previous section to configure
computers to forward and collect events. However, workgroups require
some additional steps and considerations:
You can only use Normal mode (Pull) subscriptions.
You must add a Windows Firewall exception for Remote Event Log Management on each source computer.
You
must add an account with administrator privileges to the Event Log
Readers group on each source computer. You must specify this account in
the Configure Advanced Subscription Settings dialog box when you create a
subscription on the collector computer.
Type winrm set winrm/config/client @{TrustedHosts=“<sources>”}
at a command prompt on the collector computer to allow all of the
source computers to use NTLM authentication when communicating with
WinRM on the collector computer. Run this command only once. Where <sources>
appears in the command, substitute a comma-separated list of the names
of all of the participating source computers in the workgroup.
Alternatively, you can use wildcards to match the names of all the
source computers. For example, if you want to configure a set of source
computers that each has a name that begins with msft, you could type the command winrm set winrm/config/client @{TrustedHosts=“msft*”} on the collector computer. To learn more about this command, type winrm help config at a command prompt.
If
you configure a subscription to use the HTTPS protocol by using the
HTTPS option in Advanced Subscription Settings, you must also set
corresponding Windows Firewall exceptions for port 443. For a
subscription that uses Normal (PULL mode) delivery optimization, you
must set the exception only on the source computers. For a subscription
that uses either Minimize Bandwidth or Minimize Latency (PUSH mode)
delivery optimizations, you must set the exception on both the source
and collector computers.
If you intend to
specify a user account by selecting the Specific User option in
Advanced Subscription Settings when creating the subscription, you must
ensure that the account is a member of the local Administrators group on
each of the source computers in step 4 in the previous procedure
instead of adding the machine account of the collector computer.
Alternatively, you can use the Windows Event Log command-line utility to
grant an account access to individual logs. To learn more about this
command-line utility, type wevtutil -? at a command prompt.
Creating a New Subscription
To configure a new subscription, follow these steps:
1. | Right-click
Subscriptions in the Event Viewer tree view and then select Create
Subscription, or select the Subscriptions node and click on the Create
Subscription action in the Actions pane.
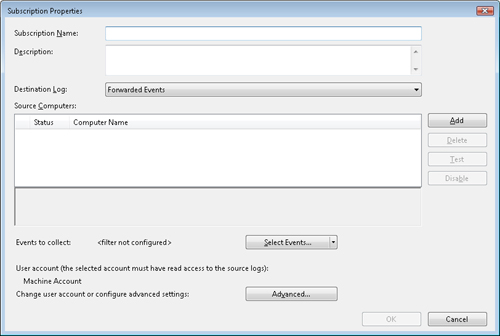 |
2. | In the Subscription Properties window, enter the Subscription Name.
|
3. | Select
the Destination Log name to save the subscribed events to. By default,
the event subscriptions will be collected in the ForwardedEvents log.
|
4. | Add
the Source Computers that the subscription will pull data from. The
“Test” button can be used to test connectivity to the selected computer
and ensure the collector will have access to that machine to collect
events.
|
5. | Click
Select Events to configure the specific events that you want to
collect. The Select Events button presents two options when you click
the drop-list:
- Edit Opens the Query Filter dialog box to allow the creation of an event filter to be used for the subscription
- Copy From Existing Custom View Allows the selection of an existing Custom View to be used for the subscription
|
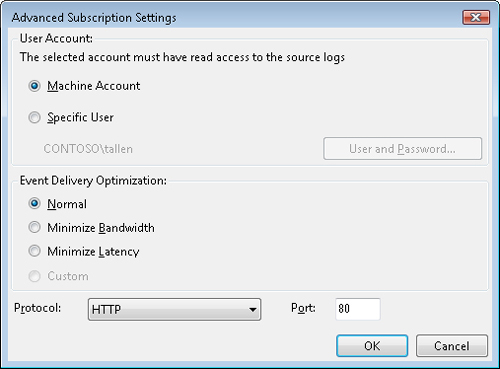
1. | Click Advanced to configure the options shown in the following dialog box.
 |
2. | After
you create the subscription, you can view and configure it from the
middle pane of Event Viewer. For each subscription, you can see its
name, status, participating source computers and description. To view
detailed status for each source computer participating in a
subscription, open the Subscription Properties dialog for the
subscription of interest. The source computers list displays the list of
participating computers and the status for each. Selecting a specific
computer in the list will display detailed status in the box underneath
the computer list, and if there is a problem with that computer the
detailed status also includes possible causes and remedies. Individual
computers can be temporarily disabled from participating in the
subscription by selecting the computer in the list and clicking Disable.
In addition, an entire subscription can be temporarily disabled by
selecting the subscription in the Subscriptions list in the main MMC
middle pane and clicking the Disable action. Also, individual computers
or the entire subscription may be retried (to check if previous problems
have been remedied, for example), by selecting the computer or entire
subscription, respectively, and clicking Retry.
|
The Advanced button
lets you configure how collected events are delivered and also lets you
specify the account used to manage the process of collecting events.
Event Viewer provides three event delivery optimization options: Normal,
Minimize Bandwidth, and Minimize Latency. Table 3 describes each of these three options.
Table 3. Optimization Delivery Options for Configuring Event Collection
| Event delivery optimization method | Description |
|---|
| Normal | Ensures
reliable delivery of events and does not attempt to conserve bandwidth.
This is the appropriate choice unless you need tighter control over
bandwidth usage or need forwarded events delivered as quickly as
possible. This method uses pull delivery mode, batches 5 items at a
time, and sets a batch time-out of 15 minutes. |
| Minimize Bandwidth | Ensures
that the use of network bandwidth for event delivery is strictly
controlled. This is an appropriate choice if you want to limit the
frequency of network connections made to deliver events. This method
uses push delivery mode and sets a batch time-out of 6 hours. This
method also uses a heartbeat interval of 6 hours. |
| Minimize Latency | Ensures
that events are delivered with minimal delay. This is an appropriate
choice if you are collecting alerts or critical events. This method uses
push delivery mode and sets a batch time-out of 30 seconds. |
Actions Pane
Previous versions of Event Viewer were MMC 2.0
snap-ins and thus did not have the Actions pane. Event Viewer in Windows
Vista and Windows Server Code Name “Longhorn” is an MMC 3.0 snap-in and
contains an all-new Actions pane on the far right side of the user
interface. This pane displays actions that can be performed on the
currently selected item in the left pane (tree view). The Actions pane
changes based on what is highlighted in the tree view. The actions that
can be performed will normally be the same as the shortcut menu actions.
Table 4
lists and describes the actions that you can perform on an event. Note
that some of the object-specific actions in the actions pane will change
(show up or hide) depending on the context you are in, i.e. the node
that you have selected in the scope pane (tree) or results pane
(middle). So this list is only relevant when you have a log selected in
the tree and an event selected in the middle pane. Also note that the
actions are categorized in several groups; mainly the top group applies
globally (no selection required) or to the selected tree node (e.g.
log), whereas the bottom group applies to the selected middle-pane
object (e.g. specific event).
Table 4. Available Actions That Can be Performed on Events
| Action | Description |
|---|
| Open Saved Log | Opens a new log file in the current view. Log file must be EVTX, EVT, or ETL format. |
| Create Custom View | Opens the Create Custom View (filter) Wizard. |
| Import Custom View | Allows the user to import a view that has been saved in XML format. |
| Clear Log | Clears the selected event log of all events. |
| Filter Current Log | Opens the Filter Wizard. You create filters the same way that you create views. |
| Properties | Opens the properties of the currently selected event. |
| Find | Offers a generic Find dialog box to search for text. |
| Save Events As | Allows the user to save a log file in ELF or XML format. |
| View | Provides options to customize the MMC view and to show Analytic and Debug Logs. |
| Refresh | Refreshes the event log. |
| Help | Activates the Help menu. |
| Event Properties | Only active when an event is selected. This is the same as the Properties Action. |
| Attach Task To This Event | Opens
the Task Scheduler Wizard with the Event Log, Event Source, and Event
ID automatically populated. The user can attach any task to an event
using Task Scheduler. |
| Copy | Copies the XML event text to the clipboard. |
| Save Selected Event(s) | Saves only selected events to ELF or XML format. |