Working with your performance data is part science
and part art. Windows Server 2008 R2 has thousands of performance
counters with which you can view, track, and perform analysis. Part of
the trick to doing analysis is to understand how the different counters
work together to give you an overall picture of the server.
You will see in the following
sections some of the new tools in Windows Server 2008 R2, such as the
system health report, that will provide you with some excellent pictures
of your server from the hardware and software perspectives.
You will also see the basics of
how to work with the Performance Monitor and the built-in reliability
tools on your server to keep your server running properly.
1. Create a System Health Report
One of the tools you can use to
help troubleshoot problems is the system health report. The system
health report includes suggestions to help improve the overall health
and performance of the Windows Server 2008 R2 server. The report
provides suggestions based on the performance of your server across many
aspects:
Software configuration
Hardware configuration
CPU
Network
Disk
Memory
The system health report is
also a handy report if you have no knowledge about a server and want to
learn more about the server quickly. When you run the report, it will
take some time to run to generate information you will be able to use
improve the performance. You will need to be a member of the local
Administrators group to generate the report. The system health report is
located in the Control Panel on your server.
Open Control Panel by selecting Start => Control Panel.
Click System And Security.
Click Generate A System Health Report, which is located in the Administrative Tools section.
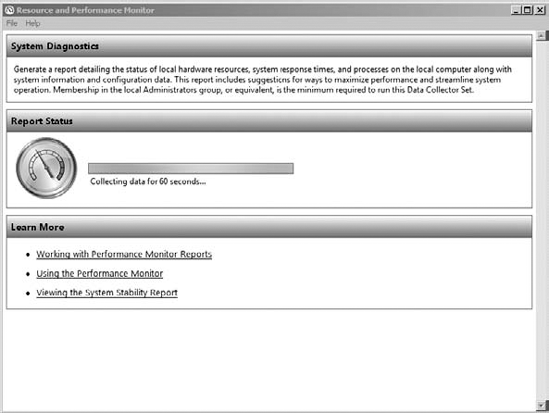
After you click Generate A System Health Report, you will see a screen similar to Figure 1; the report will take up to 60 seconds to generate.
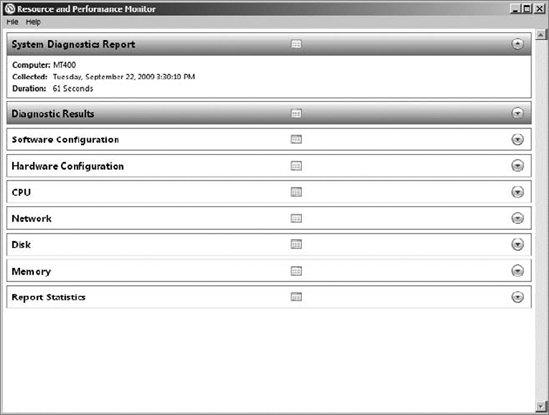
After the report is generated, you'll see a screen similar to Figure 2.

When you start looking at a
report, you will notice the several categories and the arrows next to
the category headings to allow you to expand the sections to view more
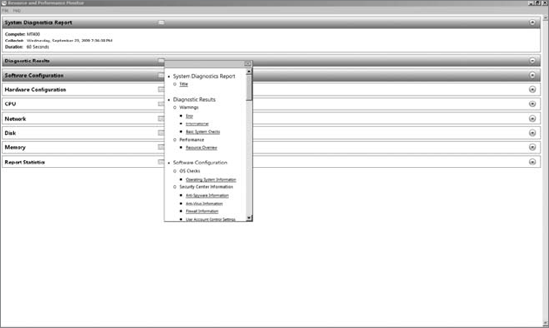
information about the report. You may also notice in the middle of each
heading bar there is an icon that looks like a three-column table. This
icon allows you to open the table of contents for the report. When you
click one of the icons, you will see a screen similar to Figure 3.


The contents screen will
allow you to quickly view any portion of the report. In addition to the
individual categories you see in the report, you'll see a wealth of
summary information for your server. There is also one area that will
provide a quick snapshot of the overall performance of your server. This
area is called the resource overview, and you can see an example of it in Figure 4.

This report not only will
give you a general utilization of your server but will also tell you
which areas of your server are being the most utilized. For example,
when you look at the network utilization, the report will tell you what
the most utilized network adapter on your server is.
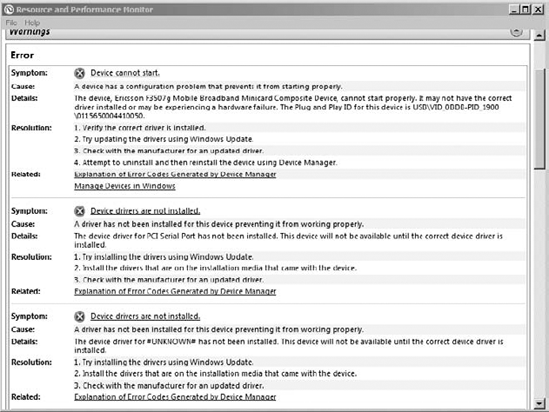
If the report has warnings, you will see a screen similar to Figure 5.

As you can see, the warnings
will tell you the issue and give you steps for resolution. Depending on
the nature of the warning, the resolutions may be basic. For example, if
you have a hardware warning because of a faulty driver, the system
health report will tell you what to do, but the advice is fairly
generic:
Verify the correct driver is installed.
Try updating the drivers using Windows Update.
Check with the manufacturer for an updated driver.
Attempt to uninstall and then reinstall the device using the Device Manager.