2. Understand Performance Monitor
When you look at all the tools
on your Windows Server 2008 R2 server providing you with performance
data, you'll see they are all derived in some fashion from the same data
you can generate in the Performance Monitor. As your server's operating
systems become more sophisticated, you have many new and useful tools
like the system health report allowing you to make sense out of the
performance data on your server. This section will give you a brief look
at how to leverage the data in the Performance Monitor.
When you look at the reports you
can generate, you may want a more detailed picture of what is going on
under the hood of your server. This is where the Performance Monitor can
help you get into the details of all the data. You can use it to see
how many of the different performance data points relate to each other
and get the bigger picture. Learning to use the Performance Monitor is a
combination of knowing what you are looking for, knowing how to use the
tool, and knowing what counters can help you find the areas for
improvement.
For example, if you want to
monitor memory usage on your system, it is not enough to just look at
the counters on the Memory object in the Performance Monitor. You may
also want to look at disk I/O. You may be wondering why disk I/O is
important. Remember, part of the memory usage on your system is done by
the paging file on your system. For example, if you notice memory is not
performing optimally, you may decide to add more RAM to your server but
then see some of the same issues. Your problem really could have been
because of slow reads and writes for the page file because of a slow or
faulty hard drive. In other words, you had a false positive test, but
you only looked at one portion of the story to determine your issue. The
moral is simply that there are many factors to help you determine the
performance of your server, and you need to try to do your best to look
at as many factors as you can.
You also need to have some
historical perspective when you are using the Performance Monitor. What
does this mean to you? It offers you a baseline. Sure, you can turn on
the Performance Monitor any time you want to peek at the system data.
However, factors such as the time of day, the current workload on the
server, the number of users logged on, and many other factors could skew
your results. Normally, when you run the Performance Monitor, you want
to run the counters before, during, and after the workload you are
testing on the server. This will give you the most accurate and thorough
results. This will also allow you to put your results in context. More
important, the Performance Monitor will also allow you to save your
results and compare them to a report run several months after you ran
the original report.
2.1. Work with the Resource Monitor
To begin using the
Performance Monitor, you can load the tool via Server Manager and use
the Performance Monitor located under the Diagnostics node. You can also
load the Performance Monitor in the administrative tools (by selecting
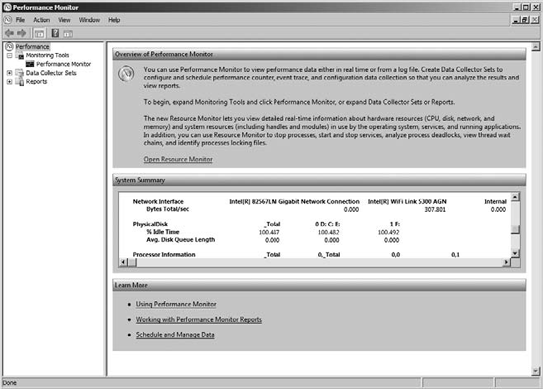
Start => Administrative Tools and clicking Performance Monitor), as shown in Figure 6.
Before you start to
add your own Performance Monitor counters and build your own data
collector sets, you need to look closely at the summary screen when you
first load the tool. You have a nice collection of summary information
provided for you initially. From the base summary screen, you can gain
some nice summary information about the four main resources on your
server: memory, CPU, hard drive, and network.
You will also find a tool new to
Windows Server 2008 R2 called the Resource Monitor. In the top section
of the summary screen you will see a link called Open Resource Monitor.
When you click the link, you will see a screen similar to Figure 7.
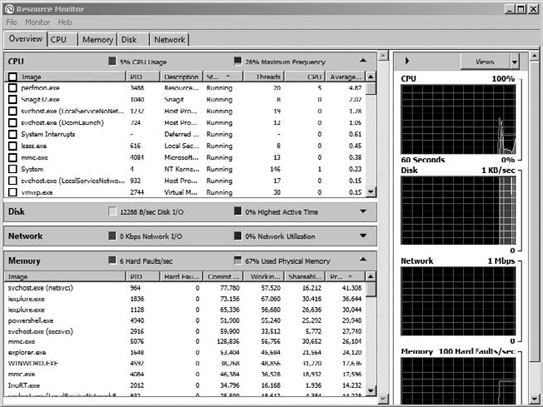
You can also load the Resource Monitor directly. The Resource Monitor is part of your system tools. Select Start => All Programs => Accessories => System Tools, and click Resource Monitor.
The Resource Monitor is
similar to Task Manager; however, the Resource Monitor has been greatly
enhanced. Just like Task Manager, you get real-time information about
what processes, disk resources, network performance, and memory access
are currently being used by your server. The Resource Monitor offers
much greater detail and access for you to see what is happening under
the hood on your server. You will also have the ability to stop
processes and start and stop services. You can also get even more
valuable information to help the developers in your organization help
debug applications. In the Resource Monitor, you get debuggers to
diagnose application hangs and deadlocks. One option for working with
application problems is by looking at a wait chain. Essentially, a wait
chain is the order in which your threads of process execution occur.
Each thread in a chain will wait for the additional threads following
the initial thread; by analyzing the wait chain, you can potentially
discover what is causing your application to have delays or not
function.
2.2. Run Windows Memory Diagnostics
One of the more frustrating
issues you may run into is memory issues. There can be many issues with
memory, including poorly written applications, insufficient memory, or
even a possible faulty memory chip. How do you know what could be the
cause? You generally want to rule out a faulty chip. In Windows Server
2008 R2, you have the ability to run the Windows Memory Diagnostics
tool; select Start =>
Administrative Tools, and click Windows Memory Diagnostics. You will be
presented with a choice to restart your server and check your memory or
schedule a memory check for the next time you reboot your system.
Whichever choice you make, when your server is rebooted, your physical
memory will go through several checks to ensure the integrity of your
memory chips.
When your system reboots, you will see a screen similar to Figure 8.
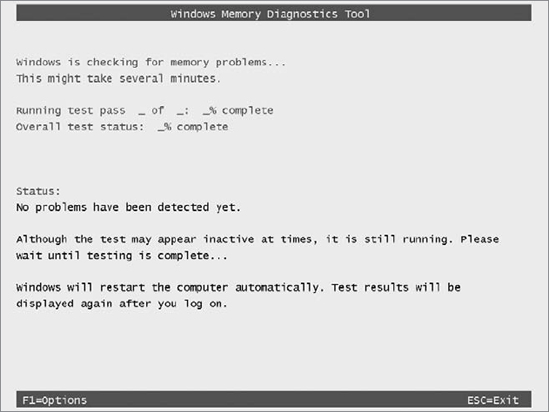
When you press F1, you will be
given a choice to perform a basic, standard, or extended test. Each test
will perform a series of tests on your server's memory. The more memory
you have, the longer the test can take. When the tests are complete,
your server will be rebooted automatically. To view the report, you need
to open the Event Viewer:
Open the Event View by selecting Start => Administrative Tools and clicking Event Viewer.
In the Event Viewer, expand the following tree location applications, and select Services Logs => Microsoft => Windows => MemoryDiagnostics-Results.
Click the event to see any errors that may have been reported.
2.3. Work with the Performance Monitor
Utilizing the Performance
Monitor will allow you to see a variety of system aspects of your
server, and when you load the Performance Monitor, your first task will
be to load counters to begin measuring and testing your server.
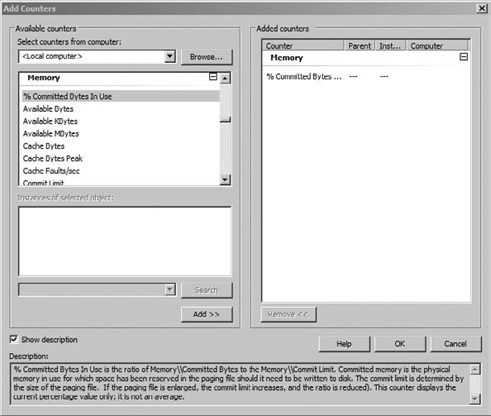
When you add counters to
measure, you have a variety of choices to add. First you will be able to
choose which systems you want to measure; by default, your local
computer is selected. You can also add counters from several main
categories. In addition to each counter, there may be several instances
you can monitor. For example, when you measure the processor, you will
be able to monitor your processor cores, or if you measure physical
disk, you will be able to measure the physical drives on your system.
As you look into the sheer
volume of counters and instances in the Performance Monitor, this may be
a little overwhelming. Try not to get overwhelmed by the data by trying
to understand each and every counter. More important, inside the Add
Counters dialog box, there is an option to show a description that will
explain the counter and, in most cases, explain what values the counter
should be if it is running healthy.
Open the Performance Monitor by selecting Start => Administrative Tools and clicking Performance Monitor.
Click the + sign next to Monitoring Tools.
Click Performance Monitor; by default you will have one counter being measured, your %processor time.
Click the green + sign in the Performance Monitor toolbar to add counters you want to measure. You will see a screen similar to Figure 9.
To
add a counter, click the category, click the counter, select the
instance you want to monitor, and then click the Add button. Your
counter will show in the list to the right, called Added Counters.
Likewise, you can also remove a counter by selecting the counter and
clicking Remove.
When
you are done adding your counters, click OK to begin monitoring the
selected data. You will see your monitor begin, and your screen may look
like Figure 10.
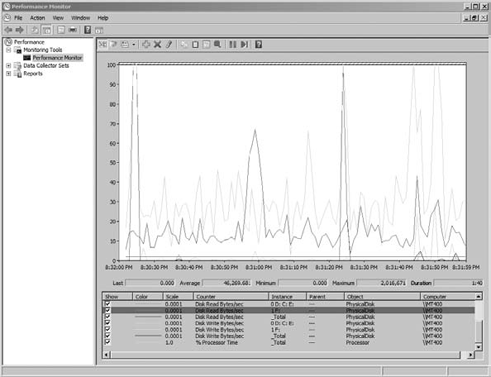
Now you will sit back and wait
for the data to populate. You may want to also start your applications
you are monitoring here as well to see how certain applications impact
your system. You can also save your Performance Monitor counters for
future logging use.
Inside the Performance Monitor, right-click Performance Monitor in the tree on the left.
Select New => Data Collector Set.
Provide a name for your data collector set, and click Next.
Select a storage location, and click Next.
Verify the creation of the set, and click Finish.
2.4. Use Data Collector Sets
Using the Performance
Monitor to measure data by adding counters one at a time is a very
reactionary way to measure your server's performance. In the Performance
Monitor, you can save your existing counters into a data collector set. Data collector sets are another built-in feature allowing you some proactive measurement for your server.
Data collector sets
allow you to organize multiple performance counters and data collection
counters into one logical object. This allows you to easily access and
work with frequently used object counters. With data collector sets, you
can create log files to track up to three areas for your performance:
Performance Monitor Allows you to log data about your selected performance counters.
Event Trace Data
Allows you to log data about various service providers on your server.
For example, you can track the performance of built-in services.
System configuration information Allows you to log data to reflect changes to your configuration. For example, you can modify specific registry keys.
Additionally, you can also use
data collector sets to proactively measure data by creating Performance
Monitor alerts. An alert will fire a set of actions you determine when a
counter meets a certain threshold.
Inside
Performance Monitor, click the + sign to expand data collector sets,
and right-click User Defined in the tree on the left.
Select New => Data Collector Set.
You
can use predetermined templates from previous collector sets. Select
Create Manually (Advanced), and then click Next. You will see a screen
similar to Figure 11.
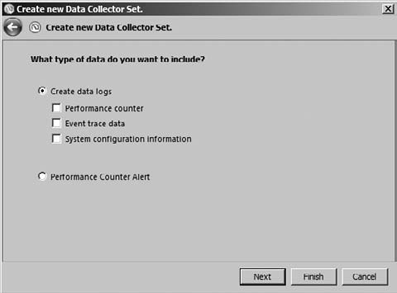
Select Performance Counter Alert, and click Next.
Add
the performance counters you want to set the alert on, set your
threshold (either above or below) for the alert, and then click Next.
Verify the creation of the set, select Start this Data Collector Set (to start the set), and click Finish.
To view the logs or reports
created by the data collector set, you need to look for the name of your
data collector set in the Reports section of the Performance Monitor
tree.