Using Performance Monitoring Tools
The process of
improving overall system performance usually begins with monitoring the
current system. Often, this involves measuring performance statistics
related to system components such as the CPU, memory, hard disk, and
network adapters. The goal is to identify any system resource
bottlenecks that might reduce overall performance. After you identify
potential problems, you can move toward resolving those issues.
In this section, you’ll look
at an overview of several different performance monitoring tools that
are available in Windows Vista. Details include how you use them to
monitor performance and ways in which this information might be helpful
for resolving common issues.
|
Anil Desai
The process of
performance monitoring involves many different aspects that you must
keep in mind. First, there’s an element of mystery solving. After you’ve
identified a problem, you need to collect performance-related clues
that help you pinpoint the source of the issue. Second, you need a solid
understanding of the ways in which operating systems and applications
interact with the underlying computer hardware. So how do you learn
these skills?
Troubleshooting actual
performance issues is probably the best way to learn and apply
performance monitoring skills. Perhaps you’re wondering what’s happening
when a particularly slow application is launched. Is the hard disk a
bottleneck? Is there a lack of physical memory? Is the problem network
related (perhaps a slow Internet connection)? The steps you take (and
tools you use) to determine the source of the problem can greatly
improve your support skills. Perhaps the best advice is always to
collect and use evidence when making changes. It’s often too easy to
just “twiddle a few knobs” and hope that will magically fix the issue.
Performance
monitoring skills go far beyond just supporting an operating system such
as Windows Vista. If you decide to move into an IT professional role
(such as working as a system administrator for a corporation), these
abilities will help you tremendously in keeping systems running at their
best. Overall, the key is to practice troubleshooting these issues
whenever possible.
|
Understanding Task Manager
Modern operating
systems can run dozens of different processes and applications, all at
the same time. Some of these processes are obvious; for example, when
you use Microsoft Word to write a new document, it’s easy to see that
it’s running. Other applications and services might not have a user
interface. When working with the Windows Vista operating system, you’ll
often want to get a quick view of all of the processes that are running
on the system. The Task Manager is a quick way to obtain these details.
There are several ways to launch the Task Manager utility, including the following:
Start menu Searching on the string “taskmgr” quickly provides a link to open the application.
Taskbar
When you right-click the Windows Vista taskbar, you’ll see an option to
launch Task Manager directly. This helps ensure that Task Manager is
located only a couple of clicks away, regardless of the number of
applications that are running on the system.
Keyboard shortcut You
can quickly open Task Manager by using the Ctrl+Shift+Esc keyboard
combination. Although it might not be the easiest method to remember,
this shortcut enables you to launch Task Manager even when many other
windows are open.
The Task Manager
user interface automatically updates with the latest details and
statistics related to system performance. For example, whenever you
start a new application or service, it appears on the corresponding tab
of the interface.
The first three tabs of the
Task Manager interface provide details related to programs that are
currently running on the computer. Specifically, there are three main
views that show this information. Each describes details about a
particular type of program that is running on the system.
Monitoring Applications
Most users are aware
that they can run numerous programs at the same time within Windows
Vista. For example, it’s common for users to have Word, Microsoft
Outlook, Microsoft Internet Explorer, and other applications running
simultaneously. You can see most running programs in the Windows Taskbar
and the system tray.
The Task Manager Applications tab shows the current programs that are running on the local computer (see Figure 1). Generally, this list corresponds to the open applications that you see on the desktop and in the taskbar.
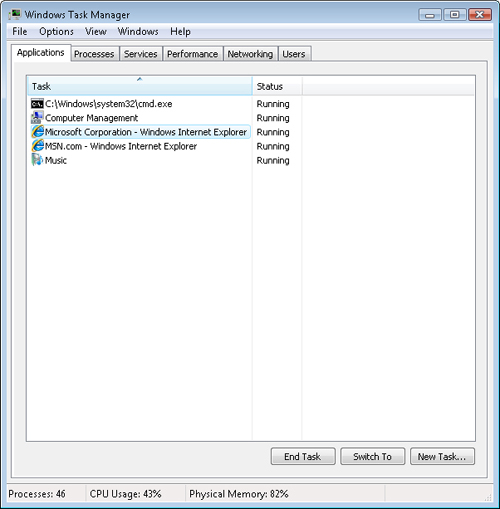
From
a performance monitoring standpoint, this is a good place to check
first when encountering performance issues. In some cases, an
application might not be responding to the operating system, or unwanted
programs might be running. You can easily close these applications by
right-clicking the appropriate item and selecting End Task. After you
end the task, the system resources it was using (such as CPU time and
memory) are returned to the operating system.
Note: Exercise caution when stopping programs
When managing
applications, processes, and services, it might be tempting simply to
shut down a variety of processes that do not seem to be needed. Keep in
mind that there are potentially dozens of tasks and services that are
required for Windows Vista to run properly. Stopping certain programs
from running might cause system instability or prevent important
functions from occurring. Also, data loss could occur if a program is
not properly terminated. If you want to free up memory by closing Word,
for example, it’s best to use the application’s Exit option.
In general, if you’re
in doubt about the purpose or function of a particular task, you should
leave it alone. Tools such as Windows Defender and antivirus products
are often able to determine automatically any unwanted or malicious
programs.
Monitoring Processes
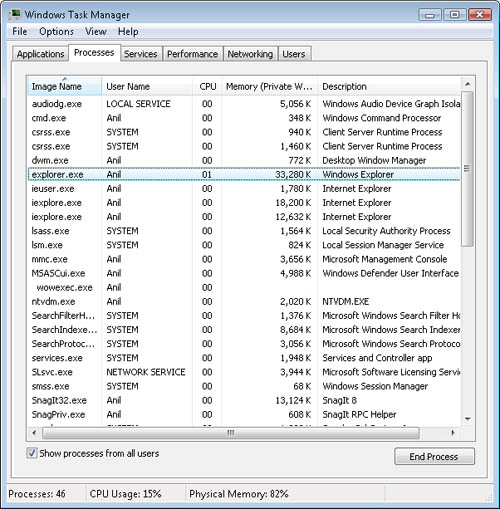
The Processes tab in Task
Manager lists all of the tasks currently running on the system. In
general, every application that is running has at least one associated
task. However, the Processes tab contains details related to processes
that might not have a user interface or that are running as part of the
operating system itself. Figure 2 shows an example.
It
can sometimes be difficult to determine what a particular process is
used for. Task Manager provides many different pieces of useful
information, including the following:
Image Name
This is the name of the actual executable file that is running on the
system. In some cases, you can use this name to determine the purpose of
the program that is running.
User Name
This is the name of the user context under which the program is
running. If the Show Processes From All Users check box is selected,
processes from all users are shown. Otherwise, only processes that were
launched by the current user are included. Some programs have the name
of a user account, whereas others are launched under special system
accounts.
Image Path Name
This information provides the fully qualified path for the executable.
If the executable name does not provide enough information, sometimes
viewing in which folder it is stored can be helpful. This column is not
shown by default but can be added using the Select Columns command in
the View menu.
Description This text displays an easy-to-read description of the process that is running, if one is available.
CPU This listing shows the current percentage of CPU time the process is using.
Memory This category shows the total amount of memory the process is using.
You can add additional
columns to the view by clicking View and choosing Select Columns. These
details can be very helpful when troubleshooting performance issues. For
example, in some cases, processes might be using large amounts of
memory when they are actually not needed. Simply closing the related
application (or ending the process) resolves the problem. It is also
possible that unwanted processes are running on the system.
One other useful option
is changing the priority of a particular process. By default, most
processes run under the Normal priority. This tells Windows Vista to
provide the same amount of CPU and other resources to each process. It’s
possible for one or more processes to start consuming a large amount of
system resources. In this case, you can right-click the process and
choose the Set Priority option to lower its priority. The process
continues to run, but other applications on the system get a higher
preference for system resources.
Monitoring Services
Windows services are
programs that are designed to run independently of a user. Unlike
applications such as Internet Explorer, they do not require users to
start them manually. Usually, services do not have a user interface, and
the operating system manages them automatically. An example is the
Windows Defender service, which is designed to start and run whenever
the operating system is running. You can configure, start, and stop
services by using the Services item in Control Panel. You can launch
this tool from the Start menu or by opening Control Panel, clicking the
System And Maintenance link, clicking the Administrative Tools link, and
then double-clicking Services.
The
Services tab in Task Manager shows details related to services that are
configured on the computer. The Name and Description columns provide
details related to the purpose and function of the service. As with
applications and processes, you can right-click a service and choose to
stop it. This is useful when you suspect that a particular service is
using significant system resources.
Monitoring Performance
So far, you have looked at
ways in which you can obtain details about applications, processes, and
services that are running on a system. Often, you’ll want to get
details about overall system resource usage first. The Task Manager
Performance tab can provide a quick overview of CPU and memory resources
and how they’re being used (see Figure 3).
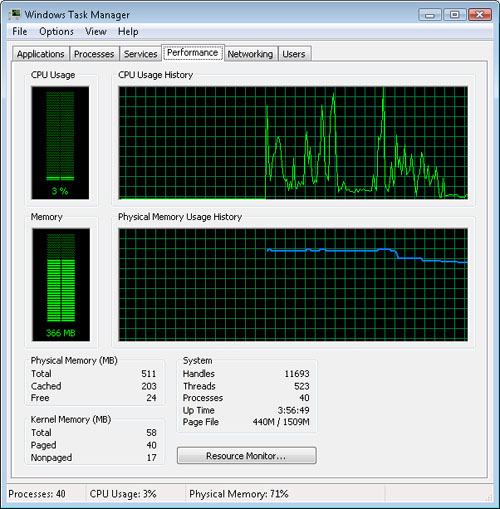
The CPU Usage and CPU
Usage History graphs show the percentage of time that the system’s
CPU(s) are in use. When the levels are consistently high (for example,
above 80 percent), it might indicate that a particular program is
slowing down the system. It is also possible that the system might need a
hardware upgrade to improve performance.
Similarly, the
Memory and Physical Memory Usage History graphs show details about how
much random access memory (RAM) the system is using. In most situations,
the amount of physical memory that is being used should be less than
the total amount of memory being used. Launching numerous applications or running memory-intensive operations can cause these numbers to increase significantly.
The bottom of the
display shows additional details related to the number of processes that
are running, how long the system has been running, and statistics
related to how physical memory is currently allocated. All of these
details can provide a quick overview of system resource use and help
identify a potential hardware constraint that might be causing slow
performance.
Gadgets for Windows Sidebar
The Windows Sidebar
provides a great way to keep useful performance-related information
available on the desktop. Windows Vista includes the CPU Meter gadget,
which is available as part of the operating system (see Figure 4).
This gadget displays two gauges that show the current amount of CPU use
and the percentage of system memory that is currently in use.
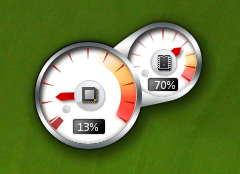
The CPU Meter provides a
convenient way to determine how current system resources are being
used. If CPU or memory use is frequently high, this might indicate that
there is a performance issue or that the computer could benefit from a
hardware upgrade.
Resource Monitor
Earlier, this lesson
mentioned the importance of monitoring CPU, disk, network, and memory
resources on the computer. Although tools such as Task Manager can
provide some of these details, the Resource Monitor is designed to
provide a quick overview of the details in a single user interface. You
can launch the Resource Monitor from the Start menu or from Task Manager
by clicking the Performance tab and then clicking Resource Monitor. You
can also access the Resource Monitor by searching for the Reliability
and Performance Monitor from the Start menu. Figure 5 provides an overview of the default view of the Resource Monitor in the Reliability and Performance Monitor application.
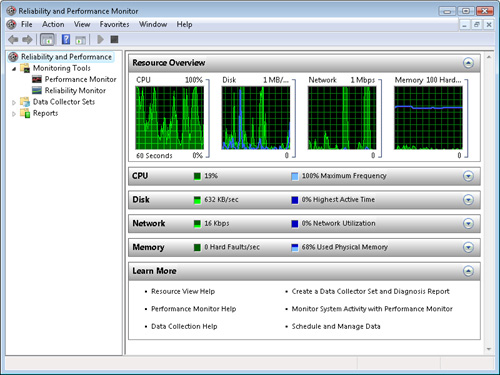
The
graphs at the top of the display provide a quick overview of resource
usage over time. Spikes or sustained high values can indicate a
potential performance bottleneck. Because statistics vary based on the
capabilities of the underlying hardware, Windows Vista might
automatically rescale each graph to reflect current values.