When a user experiences a performance problem, you need to know how to identify the source
of the problem quickly and, if necessary, resolve it. Fortunately, Windows 7 provides Task Manager to give you an overview of system performance. Task Manager also allows
you to change the priority and affinity of a process to limit the processing resources it can
consume. With Performance Monitor, you can examine thousands of details about system and
application performance in real time, or log the data for later analysis.
Data collector sets create a snapshot of a system's state, storing detailed information
about a computer's configuration for later analysis. If you identify disk input/output time as
the source of a performance problem, you might be able to resolve it by freeing up disk space
and defragmenting the disk. For mobile computers, you must consider settings that compromise
system performance in favor of extended battery life. If a problem seems to be related to a
startup service or application, you can use the System Configuration tool to selectively disable
startup processes until you identify the process causing the problem.
1. Task Manager
Task Manager is the quickest way to identify common performance problems. Windows 7 makes
it easy to open Task Manager even if the user interface isn't responding correctly. You can
open Task Manager in the following ways:
Right-click the taskbar or the system clock and then click Start Task Manager.
Press Ctrl+Alt+Del, and then click Start Task Manager. You can do this even if the user
interface is completely non-responsive.
Task Manager has six tabs:
Applications A list of applications open by the current
user. You can close an application by clicking it and then clicking End Task. If the Start
menu is not working, you can start a new application by clicking New Task. If the Windows
Explorer interface is not open, you can click New Task and then run Windows Explorer to open
it.
Processes A list of processes open by the current user.
You can view processes open by all users by clicking Show Processes From All Users. You can
quickly identify the process that is using the most processor time by clicking the CPU column
header to sort the processes by processor utilization. To end a process, select the process
and then click End Process. Ending a process is particularly useful when a non-responsive
application is consuming all the processor time and slowing the computer down.
Services Lists all the services on the computer, running
or stopped. You can start and stop services by right-clicking the service. This tab provides
similar functionality to the Services console, but with the convenience of Task
Manager.
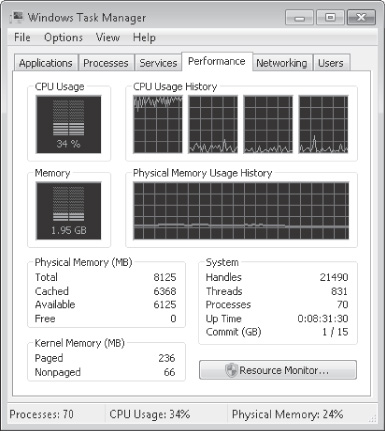
Performance Shows current processor and memory
utilization. If a computer seems slow, open the Performance tab to determine whether
processor or memory utilization is causing the problem. If processor utilization is causing
the problem, one or more of the processors in the CPU Usage History chart will be at 100%, as
the first processor is in Figure 1. If
memory utilization is causing the problem, the value shown in the Memory chart will be close
to the Total value shown in the Physical Memory group.
Networking Charts the network utilization of each network
interface. Use this tab to determine whether a slow network might be caused by an application
using all the available bandwidth. Wired network connections typically do not support more
than 70% utilization; therefore, a wired network at 65% utilization can be considered
completely saturated. Available bandwidth for wireless network connections varies, but is
typically around 35% as shown by the charts on the Networking tab.
Users Lists the users currently logged on to the
computer.
The sections that follow discuss how to perform different tasks with Task Manager.
1.1. How Windows Shares Processor Time Between Applications
To understand how to troubleshoot performance, you must know how applications, processes,
and threads relate. An application or service typically has a single process associated with
it, though some applications or services might start multiple processes. Processes run within
threads. Every application has at least one thread, and it might start multiple threads. Some
applications might use hundreds of threads.
A processor (or processor core) can only run one thread at a time. A computer with one
processor can still run multiple applications, however, because Windows switches the processor
between different processes and threads. Higher-priority threads receive more processor time
than lower-priority threads.
Today, most new computers have processors with multiple cores. Each processor core
functions like a separate processor. If you view the Performance tab of Task Manager, the CPU
Usage graph shows the total utilization across all processors, and the CPU Usage History graph
shows a separate graph for each processor core. If you see only one graph in the CPU Usage
History box, click the View menu, click CPU History, and then click One Graph Per CPU.
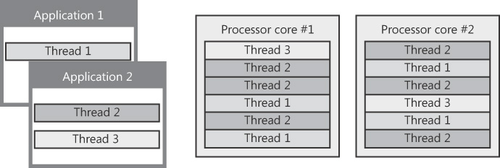
One of the most important tasks Windows performs is distributing processor time. With
multiple applications running, many having multiple threads, and multiple processor cores, the
task of distributing processor time can be very complicated. Fortunately, as Figure 2 illustrates, Windows handles it
automatically, and you rarely need to adjust the default settings.
There are some circumstances that might require you to control processes manually:
A single process is using too much processor time, slowing down other processes.
Applications are utilizing the processor fully, and you want one application to receive
more or less processor time than other applications.
An application is not responding, and you want to end the application's processes
forcibly.
The sections that follow show you how to accomplish each of these.
1.2. How to Identify Which Program Is Using the Most Processor Time
You can use Task Manager to identify a process that is using excessive processor time.
Optionally, you can end the process forcibly by performing these steps:
On the Processes tab, click the CPU column heading.
The process consuming the most processor time is shown at the top of the list.
With the busiest process identified, you can change the priority of the process (which
might improve the performance of other applications), end the process, or limit the process
to specific processor cores by performing either of the following:
To change the priority of the process, right-click the process, select Set Priority,
and then click the desired priority. Lower-priority processes receive less processor time,
whereas higher-priority processes receive more processor time. Most processes run with
Normal priority. Task Manager is a notable exception; it runs at High priority by default
so that you can use it if another application is consuming significant amounts of
processor time. Avoid giving any process Realtime priority, because it might slow the user
interface.
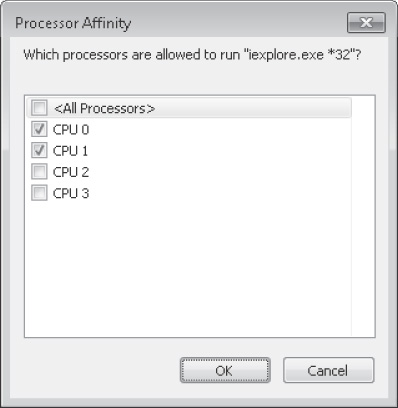
By default, Windows can assign a process to run on any processor core. To limit the
process to specific processor cores on a computer with multiple cores, right-click the
process and then click Set Affinity. Figure 3 shows the Processor Affinity dialog
box, which allows you to select which processor cores a process can use. Figure 3 shows Iexplore.exe (the Internet
Explorer process) limited to two out of four processor cores, ensuring Internet Explorer
never uses more than half the total processor time. Closing and restarting a process
resets the processor affinity.
To end the process, right-click the process and then click End Process.
Alternatively, you can click End Process Tree to end any processes that process
started.
1.3. How to Stop a Program
Occasionally, a program might not respond. Typically, you can right-click the application
on the task bar and then click Close Window. In a few seconds, Windows prompts you to
terminate the nonresponsive application.
If that approach does not work, you can use Task Manager to close an application as follows:
In Task Manager, on the Applications tab, select the application.
If Task Manager cannot end the application, the End Program dialog box appears. Click
End Now.
If you want to identify which process is associated with an application, right-click the
application on the Applications tab, and then click Go To Process.
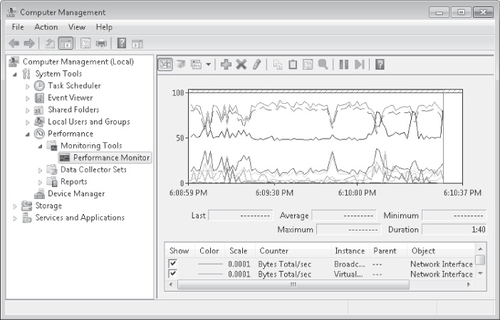
2. Performance Monitor
Like earlier versions of Windows, the Performance Monitor snap-in graphically displays
real-time data, as shown in Figure 4.
The sections that follow describe how to monitor real-time data, how to configure the
Performance Monitor chart, and how to compare multiple graphs.
2.1. How to Monitor Real-Time Performance Data
To open Performance Monitor, follow these steps:
Click Start, right-click Computer, and then click Manage.
Expand System Tools, expand Performance, and then expand Monitoring Tools. Select
Performance Monitor.
Add counters to the real-time graph by clicking the green plus button on the toolbar.
You can also display data from other computers on the network.
Each line on the graph appears in a different color. To make it easier to view a specific
graph, select a counter and press Ctrl+H. The selected counter appears bold and in black on
the graph.
Performance Monitor automatically assigns line colors and styles to the counters you
select. To configure line colors and styles manually, follow these steps:
Click the Action menu, and then click Properties.
The Performance Monitor Properties dialog box appears.
In the Counters list, select the counter you want to configure. Then, adjust the Color,
Width, and Style settings.
To increase the height of the graph for a counter, click the Scale list and click a
higher number. To decrease the height of a graph, click the Scale list and click a lower
number.
You can also adjust the scale for all counters by clicking the Graph tab and changing
the Maximum and Minimum values in the Vertical Scale group. Click OK.
If you keep multiple Performance Monitor windows open simultaneously, you can make it
easier to quickly distinguish between the windows by changing the background color on the
chart using the Appearance tab in the Performance Monitor Properties dialog box.
2.2. How to Control How Much Data Appears in the Graph
By default, Performance Monitor updates the graphs once per second and displays 100
seconds of data. To display data over a longer period of time, you can increase the sampling
interval or increase the amount of data displayed on the graph at once. To adjust these
settings, follow these steps in Performance Monitor:
Click the Action menu, and then click Properties.
The Performance Monitor Properties dialog box appears.
In the General tab, in the Graph Elements group, adjust the Sample Every box to change
how frequently the graph updates. Use a longer interval (such as five seconds) to show a
smoother, less jagged graph that is updated less frequently. If you are connecting to a
computer across a network, longer intervals reduce bandwidth usage.
Adjust the Duration box to change how much data is displayed in the graph before
Performance Monitor begins overwriting the graph on the left portion of the
chart. To display one full hour of data in the graph, set the duration to 3,600. To display
one full day of data in the graph, set the duration to 86,400. If you increase the Duration
box, you should also increase the Sample Every box. Click OK.
By default, Performance Monitor begins overwriting graphed data on the left portion of
the chart after the specified duration has been reached. When graphing data over a long period
of time, it's typically easier to see the chart scroll from right to left, similar to the way
Task Manager shows data. To configure the Performance Monitor graph to scroll data, perform
these steps:
Click the Action menu, and then click Properties.
The Performance Monitor Properties dialog box appears.
Click the Graph tab. In the Scroll Style group, select Scroll. Click OK.
Although the line chart shows the most information, you can select from the following
chart types by clicking the Change Graph Type button on the toolbar or by pressing
Ctrl+G:
Line The default setting, this shows values over time as
lines on the chart.
Histogram bar This shows a bar graph with the most
recent values for each counter displayed. If you have a large number of values and you're
primarily interested in the current value (rather than the value of each counter over time),
this will be easier to read than the line chart.
Report This text report lists each current value.
