2. Phase 2: Create, Execute, and Analyze
Having done your planning, you
can enter phase 2. Your goals in phase 2 are to create your tests, to
execute them, and to analyze the results.
Your deliverables from this phase are as follows:
The actual performance tests using your tool of choice (Visual Studio, LoadGen, and so on)
The results of each performance test and whether the test passed the exit criteria
An analysis of the performance counters that were captured during the tests
So, you have created your
plan and you know exactly what you are going to test, how you are going
to test it, and what the expected outcomes of each test are—now what?
Well, you need to accurately create a series of tests that implement the
goals outlined in phase 1. Additionally, you need to monitor the
results of those tests to determine what exit criteria have been met.
Luckily, one of the big improvements over the past 3 years has been in
the tool set for this area. Each of the tools will be described as they
are appropriate.
2.1. Creating Your Load Tests Using Visual Studio Team Suite
Depending on the type and
complexity of the tests you want to run, you have a couple of different
options for creating them. The simplest approach is to use Visual Studio
Team Suite to create a set of unit tests that can be used to create
messages and submit them into a queue or receive location. The easiest
approach for this is to create a generic "message maker" component that
reads a particular schema and gets values for new messages based on
entries in a database table (this is why it is important to put your
data in a database). The first thing you need to do is use the xsd
command to generate a typed dataset for the XSD schema using the
following syntax:
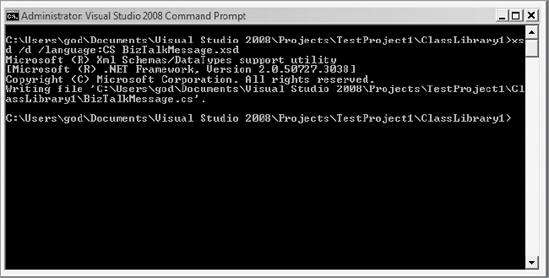
xsd /d /language:CS C:\BizTalkMessage.xsd /namespace:ProBizTalk2009
Figure 1
shows an example execution of the xsd command using the syntax that
we've just shown. The result is a class file that we can use in our
message maker component.
The message maker component
will be responsible for loading the typed dataset and populating it with
data from our database of test values. The class has intelligence in it
to cycle through the rows in the table and mark that a row has been
used in a test. If all rows are used, then it resets all usage marks and
starts over. This is a very handy class because it is generic enough to
be called from a Visual Studio unit test or from LoadGen, as you will
see in the next section.
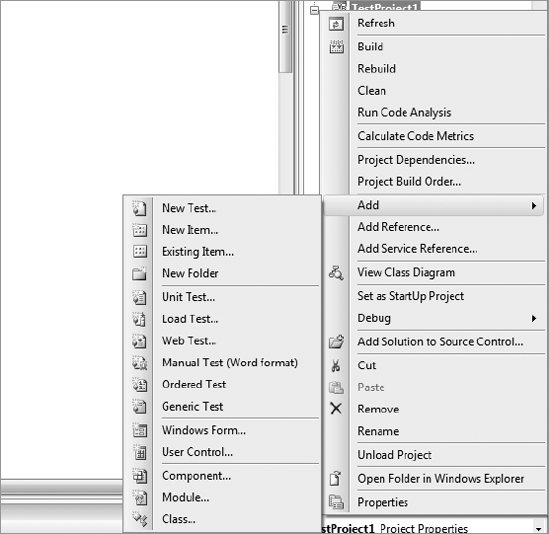
We then use Visual Studio to create a unit test for our message maker component, as shown in Figure 2. We navigate to Add and then select Unit Test.
Once we create our unit test,
all we need to do is create some simple iterative code that loops over
our message creation a fixed number of times. This will, in effect,
create a series of dynamic messages that can be used to test a single
transaction. This is by far the easiest and most straightforward way to
do performance testing in BizTalk. It also has the advantage of being
tracked and can be reported against in Team Foundation Server. In
reality, most performance tests can be modeled only so far using this
technique before the amount of test harness code starts to become
nontrivial to manage. In these cases, we need to move up to using
LoadGen.
2.2. Creating Your Load Tests Using LoadGen 2007
The LoadGen 2007
tool is one of the big advances in tools for BizTalk performance
testing. Although not officially part of BizTalk Server, it is one of
the best tools available for properly modeling load within BizTalk
Server. LoadGen comes with its own series of help files and
documentation designed to support the tool, so we won't try to teach you
the tool in great detail. What we will cover are the key things you
will want to use LoadGen for and what sorts of customization you will
want to do once you become comfortable with LoadGen.
2.2.1. LoadGen 101
LoadGen is essentially a
command-line tool that allows you to provide configuration data to the
tool itself through .NET configuration files. You can also customize the
tool by providing your own code to be executed during a LoadGen test.
There are mechanisms for submitting messages to BizTalk natively using
one of the transport component interfaces such as MSMQ, File, WSE, WCF,
SOAP, MQSeries, and so on. These transport components allow you to use
the native adapters within BizTalk and have LoadGen submit messages
using those adapters without having to write any "glue code." If your
particular adapter transport isn't available, you have the option of
writing your own using LoadGen's API or creating a WCF service that
calls whatever underlying transport you may have.
LoadGen implements the
concept of throttling and monitoring so that you can dynamically
throttle back your load test should your solution become overdriven.
These throttling behaviors are controlled by a series of monitor
components that can look at a variety of things such as performance
counters, SQL Server, files, and delivery rates. Like everything in
Load-Gen, if there is something you need that isn't supported out of the
box, you can use the API to create your own monitor components.
You execute LoadGen by calling this:
$LoadGenInstallDir\Bins\LoadGenConsole <configurationfile>
The configuration file
is essentially the run data that LoadGen will load for that particular
execution. Sample configuration files are provided within the tool and
cover many basic scenarios. The configuration file specifies the "stop"
criteria for the test and specifies other important variables such as
the retry interval for failures, the sleep time between message
submission, and the types of transports to be used. The following
configuration file is a sample that shows how you would do a simple file
drop with a monitor:
<LoadGenFramework>
    <CommonSection>
        <LoadGenVersion>2</LoadGenVersion>
        <OptimizeLimitFileSize>204800</OptimizeLimitFileSize>
        <NumThreadsPerSection>5</NumThreadsPerSection>
        <SleepInterval>200</SleepInterval>
        <LotSizePerInterval>25</LotSizePerInterval>
        <RetryInterval>10000</RetryInterval>
        <StopMode Mode="Files">
            <NumFiles>5000</NumFiles>
            <TotalTime>3600</TotalTime>
        </StopMode>
        <Transport Name="FILE">
            <Assembly>FileTransport.dll/FileTransport.FileTransport</Assembly>
        </Transport>
        <ThrottleController Mode="Custom">
            <Monitor Name="File">
        <Assembly>FileMonitor.dll/DropLocationFileMonitor
.DropLocationFileMonitor</Assembly>
                <ThresholdRange>1000-2000</ThresholdRange>
                <SleepInterval>1000</SleepInterval>
                <Parameters>C:\Scenarios\FileToFile\Receive</Parameters>
            </Monitor>
            <ThrottleCondition>File</ThrottleCondition>
        </ThrottleController>
    </CommonSection>
    <Section Name="FileSection">
        <SrcFilePath>C:\LoadGen\ConfigFiles\ConsoleConfigFiles\
FileToFileLG.xml</SrcFilePath>
        <DstLocation>
            <Parameters>
                <DstFilePath>C:\Scenarios\FileToFile\Receive</DstFilePath>
            </Parameters>
        </DstLocation>
    </Section>
</LoadGenFramework>
2.2.2. Creating Messages Using Data Files
There are three ways to
create messages with LoadGen. The first that we'll discuss is using data
files as a source for creating messages.
By default LoadGen will use messages that are stored in an input file as specified in the LoadGen configuration file element <SrcFilePath>.
Essentially, XML messages that are in this file are used as input for
LoadGen when it needs to submit a new message. This is easy to
configure, but it's too simplistic for most needs. If your data is
static and able to be modeled in this way, then this option is a good
choice.
2.2.3. Creating Messages Using the Custom Message Creator
LoadGen ships with a
component called the CustomMC, or the Custom Message Creator component.
This allows you to control the message creation behavior by using the <MessageCreator>
tag in your configuration file and specifying a template for the
CustomMC component to load. The following XML file shows how this is
done:
<Section Name="FileSection">
      <Transport Name="FILE">
        <Assembly>FileTransport.dll/FileTransport.FileTransport</Assembly>
      </Transport>
      <SrcFilePath>C:\Scenarios\SourceData.xml</SrcFilePath>
      <DstLocation>
        <Parameters>
          <DstFilePath>C:\Scenrios\Receive</DstFilePath>
        </Parameters>
      </DstLocation>

          <MessageCreator Mode="Asynchronous">
          <SleepInterval>1</SleepInterval>
          <QueueLength>10</QueueLength>
          <Assembly>CustomMC.dll/CustomMC.CustomMC</Assembly>
          <TemplateFilePath>C:\Scenarios\TemplateFile_MC.xml</TemplateFilePath>
      </MessageCreator>
The template file will contain the following entries:
<MessageCreator SourceFilePath="SampleSource.xml"
NumDuplicates="1" OutEncoding="ascii">
    <Field>
        <InitialValue>IDField_0</InitialValue>
        <DataType>Guid</DataType>
        <InputFilePath></InputFilePath>
        <ContentMinSize>1</ContentMinSize>
        <ContentMaxSize>1024</ContentMaxSize>
        <AllowDuplictaes>False</AllowDuplictaes>
    </Field>
</MessageCreator>
This template is
essentially the layout for the dynamic fields that LoadGen will populate
based on the data specified in the file SampleSource.xml. Assume the
sample file has the following data:
<PurchaseOrder>
    <CustomerID>IDField_0</CustomerID>
    <ContactInfo>IDField_0</ContactInfo>
    <OrderNumber>IDField_1<OrderNumber>
</PurchaseOrder>
All instances of IDField_0 will be replaced with a new GUID value. Table 1 shows the possible types that can be replaced by CustomMC.
Table 1. CustomMC Replaceable Datatypes
| value | Description |
|---|
| Integer | The new value is randomly generated within the range given by the <ContentMaxSize> and <ContentMinSize> elements. |
| Guid | The new value is generated with a unique GUID. |
| RandomSelection | The new value is randomly chosen from the values in the file specified by the <InputFilePath> element. |
| Timestamp | The current date and time on this computer is used for the new value in the "ddd, dd MMM yyyy hh:mm:ss:ffffff" format. |
| IntegerSeries | An integer value greater than 100,000 is used for the new value. The value is increased by 1 whenever a new value is generated. |
As you can see, there are a
number of options to choose from, but in large performance test
scenarios where data can potentially be related to other data elements
and external factors, these options quickly become useless. The solution
to this problem is to create your own custom message creator that can
create data in any way you choose.
2.2.4. Creating Your OwnCustom Message Creator
Out of all of LoadGen's
numerous customization features, the most useful by far is the ability
to create your own message creators. A message creator is used to
control the messages that LoadGen will submit during the executed test.
The configuration section for the <Transport> tag within the configuration is modified so that your custom message creator can be invoked instead of the default one.
A custom message creator is a type that implements the IMessageCreator interface. This interface has one method called CreateNewMessage, which passes three properties:
- OriginalMessage:
The message object containing the content of the file that the <SrcFilePath> element indicates
- TemplateFilePath:
The file path that is in the <TemplateFilePath> element in the parent <MessageCreator> element
- NewMessageUniqueFileSuffix:
The number of messages that a LoadGen task thread has created
The method returns a new Message object, which will be submitted to BizTalk. The Message object is a LoadGen message type that has the following constructor:
Message constructor (byte[], long, string, string)
The constructor initializes a new instance of the Message class with the following parameters:
- byte[] MessageData:
The array of bytes containing the message data
- long MessageLength:
The size of the message data
- string MessageExtension:
The extension of a file that contains the message data
It has the following properties, which are traditionally passed on the constructor:
MessageData property:The array of bytes containing the message data
- MessagePath property:
The path of a file that contains the message data
- MessageExtension property:
The extension of a file that contains the message data
- MessageLength property:
The size of the message data
Using the Message class,
you can create messages and message constructors that will behave in
any way you want. The code to create these message types is actually
quite trivial and will plug into the LoadGen framework using the
configuration files, as you saw previously. The samples for this book
show a custom message creator that will read values from a data-base and
create messages based on an input schema.
2.2.5. Creating a Reset Button
A key script to create is one
that "resets" your test environment to the original state so that you
can rerun tests multiple times. Usually this involves resetting counters
in your test data so that the records will be created again, removing
any suspended instances and queued items from the BizTalk Messagebox and
resetting any downstream systems such as an ERP or a custom database
that may have been updated as a result of the tests. A number of cleanup
scripts for BizTalk are included in the book samples that you can use.
Resetting updated third-party applications can be tricky depending on
the type of system, its age, and its accessibility.
2.3. Executing Your Load Tests
As you have seen, you can
design load tests using LoadGen that can accurately model how you expect
the solution to be used in production. You can have a LoadGen
configuration file that specifies any number of different message types
to be created, each of which can use a different transport and have
different data created for each message. You can also control the data
that is placed in the message by creating your own messages using the
LoadGen API. Once you have created all tests, you need to run them.
Be prepared to run each test
several times. The first few runs will be to simply prove that the tests
are working properly. You should have a set of expected outcomes or
expected record counts created to verify that the test ran properly.
There are a few areas that you should keep a close watch on while your
test is running:
- Out-of-memory (OOM) exceptions:
BizTalk is notorious for
generating OOM exceptions. These will show up in the Event Log as a
BizTalk critical error. If you are getting OOM exceptions, something is miscon-figured
with your solution, and your first priority is to identify what
component is going OOM and troubleshoot it so that it is stable.
- General errors:
Checking the Event Log
during the performance test will help you identify potential issues as
they are occurring. BizTalk will throw any number of errors while under
load, especially DBNetLib errors. If you see these types of errors, it
is important to identify the root cause of the error before proceeding.
Errors that indicate a serious problem with the environment generally
invalidate the entire performance test.
- Downstream system errors:
It is very important
to validate that any downstream systems that were affected by the
performance tests were actually updated as expected. It is not uncommon
to see BizTalk execute the performance tests as expected but the
downstream system that was the target of the test failed to do any real
updating because of being overwhelmed by the transaction volume.
|
The first tool people
generally learn when they start performance testing is Performance
Monitor, or Perfmon. Perfmon is by far the most useful tool that comes
preinstalled on the Windows platform. It is a good idea to have the
Performance Monitor console up and running while the performance test is
executing so you can keep watch—in real time—what is happening with the
system. It is also a good idea to have the Perfmon console running on
another workstation and be remotely viewing the server's counters. This
way, you will minimize the CPU usage of Perfmon that is taking cycles
away from the application.
|
2.4. Analyzing the Results
In the old days, you would
need to hire a set of incredibly bright consultants to come into your
organization, run the performance tests for you, and analyze the test
results to give you recommendations on what counters to change. Well,
those days have been replaced by a tool called Performance Analyzer for
Logs (PAL). In the simplest terms, PAL is the bread-slicer of performance testing. PAL does the following for you:
It will tell you what counters to monitor based on the Microsoft product you are testing.
It will analyze the counters gathered from multiple machines.
It will generate reports for you of what counters violated the acceptable thresholds as published by Microsoft.
It
will tell you what areas of your solution are currently not performing
properly (CPU, memory, disk, and all well-known BizTalk counters)
It will then give you some recommendations on what settings to change to increase performance.
It does all that, it's free, and the source code is available on www.codeplex.com.
The best part is that not only does it work for BizTalk, but there are
PAL analyzer sets for most Microsoft products including SharePoint, SQL
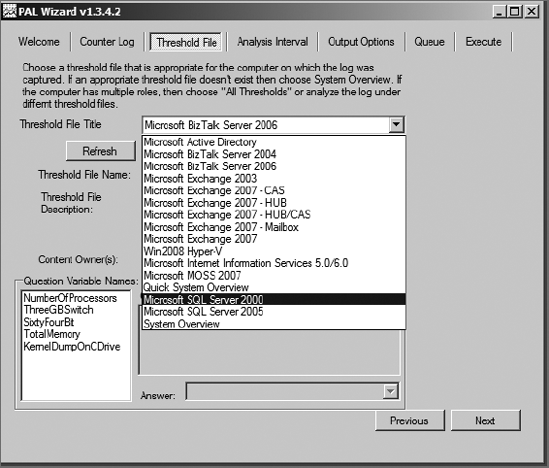
Server, Windows Server, Exchange, and IIS. It truly is a wondrous tool. Figure 3 shows the servers that can be analyzed using PAL.
The information that PAL
gives you will help take the grunt work out of identifying what counters
are worrisome and help get you pointed in the right direction so you
don't start changing settings that won't help or that will make things
worse.
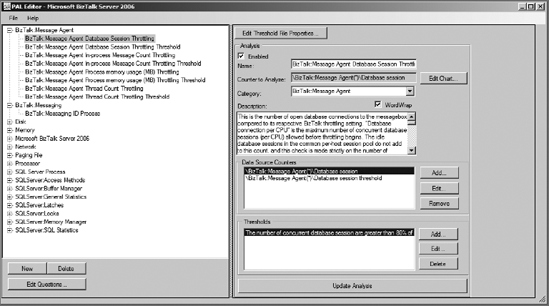
To ensure that you
are capturing the correct performance counters that PAL requires for a
particular server, you need to check the counter file for that
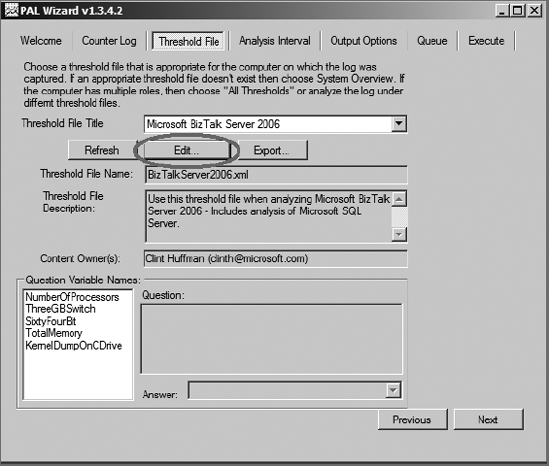
particular product. Just click the Edit button, and you will be shown
what counters a particular product is requiring, as shown in Figures 4 and 5.
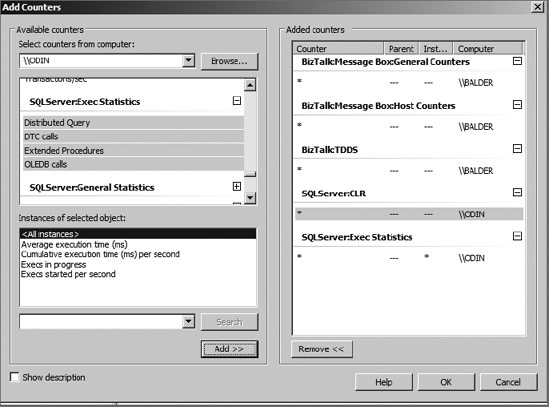
Once you have determined
what counters you need to monitor, use a workstation to record the
desired counters from each BizTalk server in your environment being
tested. Simply add the required counters from each server and log them
to a Performance Monitor Log the .blg file. It is also recommended that
you create a set of logs from each of the IIS servers in your
environment, along with a separate log file for the SQL Servers if they
do not reside on the BizTalk servers. This way you can use PAL to
analyze the logs from these environments as well and not limit the
performance testing to solely BizTalk, as shown in Figure 6.
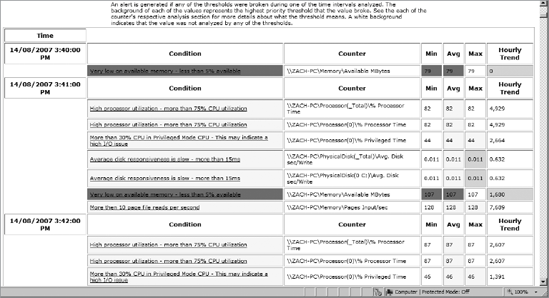
Once you have executed
your tests, stop gathering the Performance Monitor counters, and save
the .blg file to the server where you installed PAL. Once you execute
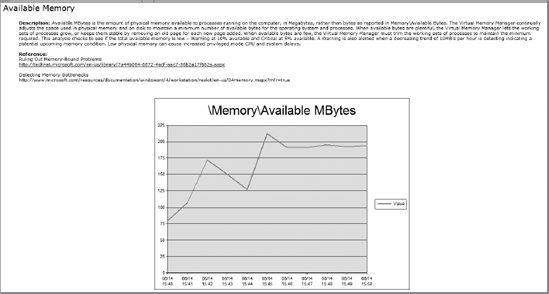
the wizard and have PAL analyze your logs, you will get detailed HTML
reports that look like Figures 7 and 8.
The reports detail the analysis of each counter of interest and whether
the threshold values are exceeded throughout the test. The reports even
detail the source of the threshold and what documentation references
that counter and its threshold values.
2.5. Checking for Errors and Validating Results
Even though PAL provides a
great way to analyze the data that Perfmon can gather, you still need to
be diligent to verify that the data PAL is analyzing is valid. Even
though a performance test may run to completion, care should be taken to
ensure that the outcomes of a performance test accurately match the
expected outcomes. For example, let's assume that your performance test
was geared around order creation. If you followed the process outlined
earlier, then you have an accurate representation of the test data that
was used during the performance test run. The last step of the test is
to go back and verify that all records that were supposed to be created
were in fact created or updated as per the expected outcomes of the
test. If there are any variances, you need to start to investigate why.
This will often lend itself to finding unknown instabilities in a
particular solution. For example, a message may become suspended should a
schema validation fail or should an adapter unexpectedly fail.
Performing this last piece of analysis will validate your tests and
provide your testing approach with a degree of credibility that it would
not otherwise have.