In prior versions of SQL Server, the tools
available for monitoring SQL Server performance were somewhat limited.
Yes, you had the Windows Performance Monitor, Activity Monitor, SQL
Server Profiler, and SQL Trace, but performing in-depth performance
monitoring usually required the purchase of third-party tools to
collect, monitor, and view performance information in a useful way.
SQL Server 2008 provide a number of tools you can use
to collect, analyze, monitor, and report performance-related data. The
usual old-timers such as SQL Server Profiler and Database Engine Tuning
Advisor still exist and are available to you, but SQL Server 2008 also
includes a new Activity Monitor, the Data Collector and management data
warehouse, SQL Utility, and SQL Server Extended Events.
1. The Data Collector and the MDW
SQL Server 2008 introduces a
new performance monitoring tool called the Data Collector. The Data
Collector is designed to collect performance-related data from multiple
sources from one or more SQL Servers, store it in a central data
warehouse, and present the data through reports in SQL Server Management
Studio. The main purpose of the Data Collector is to provide an easy
way to automate the collection of critical performance data. The Data
Collector gathers information from Windows performance counters,
snapshots of data grabbed from dynamic management views, and details on
disk utilization.
Data collection can be configured to run continuously
or on a user-defined schedule. You can adjust the scope of data
collection to suit the needs of your test and production environments.
The Data Collector provides a single central point for data collection
across your database servers and applications and, unlike SQL Trace, is
not limited to collecting performance data only.
The Data Collector feature consists of the following components:
Data collection sets— These are the definitions and scheduled jobs for collecting performance data. They are stored in the msdb system database.
The Data Collector runtime component— This standalone process, called Dcexec.exe, is responsible for loading and executing the SSIS packages that are part of a collection set.
SQL Server Integration Services (SSIS) packages— These packages are used to collect and upload the data.
The management data warehouse database—
This is a relational database where the collected data is stored. It
also contains the views and stored procedures needed for collection
management.
MDW Reports— These reports are built in to SSMS for viewing the collected performance data.
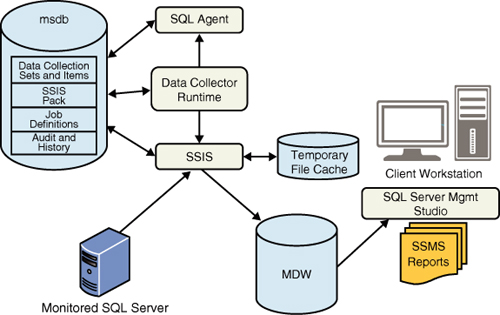
Figure 1 provides an overview of the Data Collector architecture and how the various components interact.
Note
The
Data Collector is not a zero-impact monitoring solution. It incurs
approximately a 2% to 5% performance hit on the servers where it’s
collecting data. This performance hit is mainly on the CPU.
Data Collection Sets
A data collection set is group of collection items. A collection set
is the unit of data collection that a user can interact with through
the user interface. Data collection sets are defined and deployed on a
SQL Server 2008 instance and can be run independently of each other.
Each collection set is run by a SQL Server Agent job or jobs, and data
is uploaded to the management data warehouse on a predefined schedule.
Out of the box, SQL Server 2008 provides the following built-in system data collection sets and reports:
Disk Usage—
Collects local disk usage information for all the databases of the SQL
Server instance. This information can help you determine current space
utilization and future disk space requirements for disk capacity
planning.
Server Activity—
Collects SQL Server instance-level resource usage information like CPU,
memory, and I/O. This information can help you monitor short-term to
long-term resource usage trends and identify potential resource
bottlenecks on the system. It can also be used for resource capacity
planning.
Query Statistics—
Collects individual statement-level query statistics, including query
text and query plans. This information can help you identify the top
resource-consuming queries that may need performance tuning.
The definition of the system collection sets cannot
be modified. However, you can define your own collection sets or define
your own custom reports for this data.
Data Collector Runtime Component
The Data Collector runtime component is invoked by a standalone process called Dcexec.exe.
This component manages data collection based on the definitions
provided in a collection set. The Data Collector runtime component is
responsible for loading and executing the SSIS packages that are part of
a collection set.
A collection set can be run in one of the following collection and upload modes:
Noncached mode—
Data collection and upload are executed on the same schedule. The
packages collect data as scheduled and then immediately upload data.
Cached mode—
Data collection and upload are performed on different schedules. The
collection package continues to collect and cache data until stopped.
Data is uploaded from the local cache according to the schedule
specified by the user.
Note
The Data Collector runtime component can perform only data collection or data upload. It cannot run these tasks concurrently.
SSIS Packages
The Data Collector is implemented as SSIS packages
that are invoked by the Data Collector runtime component. These packages
can be configured to run manually, continuously, or scheduled as SQL
Server Agent jobs to periodically collect and upload data to the
management data warehouse.
The two most important tasks for the SSIS packages
are data collection and data upload. These tasks are carried out by
separate packages. A collection package gathers data from a data
provider and keeps it in temporary storage. An upload package reads the
data in temporary storage, processes the data as required (for example,
removing unnecessary data points, normalizing the data, and data
aggregation) and then uploads the data to the management data warehouse.
The upload is done as a bulk insert to minimize the impact on server
performance. The separation of data collection and data upload into
separate packages provides more flexibility and efficiency. This design
supports scenarios in which snapshots of the data are captured at
frequent intervals (for example, every 15 seconds), but the collected
data needs to be uploaded only every hour. Data collection and upload
frequency should be determined by the monitoring requirements of a
particular SQL Server installation.
The Management Data Warehouse
The management data warehouse is a relational
database where the Data Collector stores its data. A single MDW database
can serve as the central repository for data collectors running on one
or more target SQL Server instances. A data collector is configured on
each target server, and it collects and uploads data to the MDW
database, which may be on a remote server. Between the time the data is
captured and the time it is uploaded, the Data Collector may write
temporary data into cache files on the target server.
Note
You can install the MDW on the same instance of SQL
Server that is running the Data Collector. However, if server resources
or performance are an issue on the server that is being monitored, you
might want to install the management data warehouse on a different
computer to avoid additional CPU and I/O contention.
The MDW can become quite large, growing at
approximately 250–500MB per day. This is roughly around 2GB of database
storage per server each week. You need to decide how long you want to
retain the data based on on your performance monitoring needs and your
storage availability. For the most part, you can probably stick with the
default retention settings, which are 14 days for Query Statistics and
Server Activity History data collections and two years for Disk Usage
Summary collections.
The
required schemas and the objects to support the predefined system
collection sets are created when you run the wizard to create the MDW.
Two schemas are created: core and snapshots. The core
schema describes the tables, stored procedures, and views used to
organize and identify collected data. These tables are shared among all
the data tables created for individual collector types. The snapshots schema describes the objects needed to store and maintain the data collected by the collector types that are provided.
A third schema, custom_snapshots, is created
if you create your own user-defined collection sets that include
collection items that use the Generic T-SQL Query collector type.
Caution
You should not directly modify any data
stored in the management data warehouse. Changing the data that you have
collected invalidates the legitimacy of the collected data. Also,
instead of directly accessing the MDW tables, you should always use the
documented stored procedures and functions provided with the Data
Collector to access instance and application data.
