Creating Data Collector Sets in Performance Monitor
A Data Collector Set
is the building block of performance monitoring and reporting in
Windows Performance Monitor. It organizes multiple data collection
points into a single component that can be used for review or to log
performance counters. A Data Collector Set can be created and then
recorded individually, grouped with other Data Collector Sets and
incorporated into logs, viewed in Performance Monitor, or configured to
generate alerts when thresholds are reached. You can set up schedules on
your Data Collector Sets to have them run the data collection at
specific times.
Data collector sets can contain the following types of Data Collectors:
Performance counters are measurements of system state
or activity. They can be included in the operating system or can be
part of individual applications. When you install SQL Server, a number
of SQL Server–specific performance counters are installed . Windows
Performance Monitor requests the current value of performance counters
at specified time intervals.
Event trace data is collected from trace providers,
which are components of the operating system or of individual
applications that report actions or events. Output from multiple trace
providers can be combined into a trace session.
Configuration information is collected from key
values in the Windows Registry. Windows Performance Monitor can record
the value of a Registry key at a specified time or interval as part of a
log file.
The easiest way to created a Data Collector Set is to
create a custom view of counters in Performance Monitor (similar to
what was shown in the previous section). When you are satisfied with the
counters and settings you have configured, right-click on the Performance Monitor node in the Monitoring Tools folder, select New, and then select Data Collector Set. This starts the Create Data Collector Set Wizard, which walks you through the following steps:
1. | The wizard prompts for a name for the Data Collector Set. Enter a name and click Next.
|
2. | Specify the root directory where the Performance Monitor log files will be written and click Next.
|
3. | Specify
if you want the Data Collector to run under a different user ID and if
you want to start the Data Collector immediately or to just save the
Data Collector Set. Click Finish to return to Performance Monitor.
|
The newly created Data Collector Set is listed under the User Defined folder in the Data Collector Sets node in Performance Monitor.
You can also create a Data Collector Set manually or from a template by right-clicking on the User Defined folder in the Data Collector Sets
node and selecting New, Data Collector Set. This launches a modified
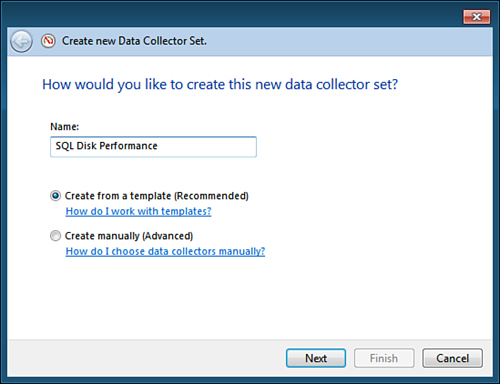
version of the Create New Data Collector Set Wizard, as shown in Figure 23.

You first specify a name for the collector set and
then choose whether to create it from a template or manually. Then you
click Next.
If you choose to create from a template, the next
screen displays the built-in templates provided with Windows; these
standard templates focus on general system performance or diagnostics.
You can also choose to import your own templates by clicking on the
Browse button.
Note
Creating your own Data Collector Set templates in
Performance Monitor is relatively easy. If you have a Data Collector Set
that you’ve set up with the performance counters and settings that you
would like to reuse, simply right-click the Data Collector Set you want
to export and click Save Template. Select a directory in which to store
the collector set as an XML file and click Save. You can now copy this
template for use on other computers.
After selecting the template, navigate to the next
screen to specify the root directory for the log files. On the final
screen, you have the option again to start the collector immediately,
save it, or open the properties for the Data Collector Set so you can
make further modifications to it, such as specifying a schedule or how
it should handle.
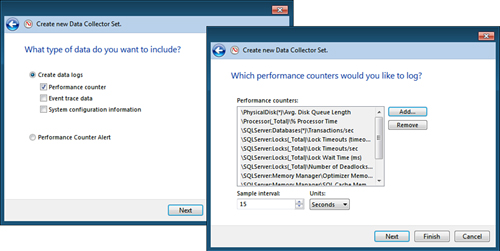
If you choose to create a new Data Collector Set
manually instead of using a template, you are presented with the screen
shown in Figure 24.
You have the option to create a Data Collector Set that generates data
logs or to create a Performance Counter Alert. If you are creating data
logs, you can specify what sort of information you want to include in
the collector set (in this example, we’re logging performance counters
only).

Depending on the Data Collector types you select, you
are presented with dialogs to add Data Collectors to your Data
Collector Set. In this example, you are presented with the dialog to add
performance counters, as shown in Figure 24.
After defining the counters, and so on, you are
presented with the familiar options to specify the root directory and
whether to save, run, or edit the properties of the Data Collector Set.
After
you create a Data Collector Set, you can add additional Data Collectors
to it as desired. They can be additional performance counter event
traces, configuration Data Collectors, or performance counter alerts.