4. Windows Performance Monitor
Windows Performance Monitor is a graphical tool that
provides a visual display of built-in Windows performance counters,
either in real-time or as a way to review historical data. It is
supplied as part of the installation of any Windows server or
workstation (in Windows Server 2008 it is called Reliability and Performance Monitor).
Hundreds of performance counters are available. These counters can be
monitored on the local machine or remotely over the network, and they
can be set up to monitor any object and counter on multiple systems at
once from one session. A small subset of performance information is also
available via the Windows Task Manager Performance tab. However, all
this information and more is available using the Performance Monitor
facility.
Note
If
you are running on Windows XP, Windows Server 2003, or earlier versions
of Windows, the interface and functionality of Performance Monitor are a
bit more limited than the version presented here. However, many of the
concepts of using Performance Monitor and performance counters are still
similar.
Performance Monitor features multiple graph views
that enable you to visually review performance log data. You can add
performance counters to Performance Monitor individually or by creating
custom Data Collector Sets. The recent version of Windows Performance
Monitor combines the functionality of previous standalone tools
including Performance Logs and Alerts (PLA), Server Performance Advisor
(SPA), and System Monitor.
You can use Windows Performance Monitor to examine
how programs you run affect your computer’s performance, both in
real-time and by collecting log data for later analysis. When you
install SQL Server, additional performance counters are installed that
you can use to monitor SQL Server performance elements such as cache
utilization, locking, wait states, and I/O performance. Performance
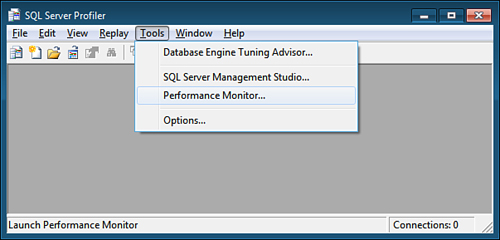
Monitor can be launched from many different points. From SQL Profiler,
choose the Tools menu option and choose the Performance Monitor item. Figure 20 shows this menu option from SQL Profiler. You can also launch it from the Administrative Tools folder in the Windows Start menu.

Performance Monitor Views
When you first launch Performance Monitor, you are
presented with the welcome screen (in Windows 2008, the welcome screen
is the Resource Overview). Click on Performance Monitor in the Monitoring Tools
folder to bring up the Performance Monitor main display. In the
Performance Monitor main display, you can view the performance
information in one of three different modes:
Graphic chart—
This view, the default, shows the selected counters as colored lines
over a timeline with the y-axis representing the value and the x-axis
representing time. You can also add gridlines (horizontal and vertical). This view lets you view performance trends over time.
Histogram chart—
This view shows the selected counters as colored horizontal bars (as in
a histogram). These histogram bars change dynamically to reflect the
data sampling values. With this view, you see a current snapshot of the
performance counters rather than the trend of activity over time.
Report display—
In this mode, you see the current values for counters collected under
their parent object in a textual display format. Like the histogram
view, this view does not show you the activity trends, just the current
sampling value, but it is great for showing what counters you are
collecting data with.
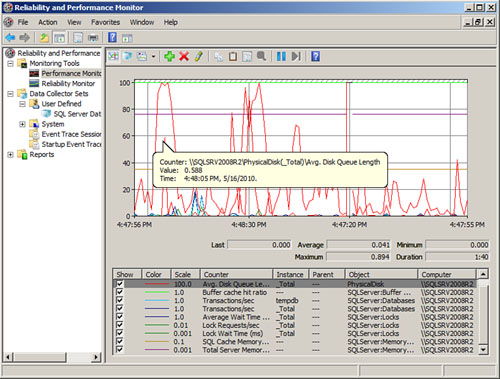
Figure 21
shows the basic graphic chart view interface for Performance Monitor
displaying several useful system counters . These counters are added to Performance Monitor through
the creation of Performance Monitor Data Collector Sets.

When you open the Performance Monitor view, depending
on the OS version you are running, you see up to three default
performance counters: Memory: Pages/sec, PhysicalDisk:Avg.Disk Queue
Length, and Processor:% Processor Time. These counters provide a good
start, but you really want to see many other counters that reflect the
complete picture of how your server is behaving.
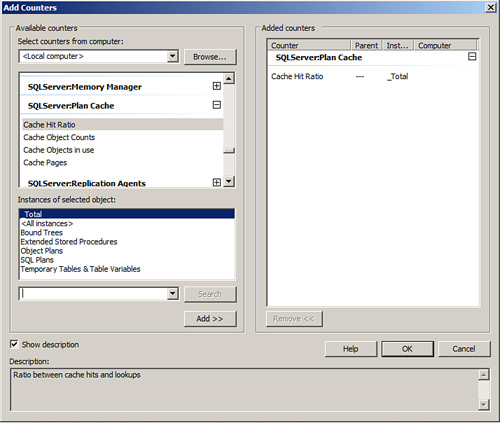
You add a counter by clicking the large plus sign toolbar button near the top. The Add Counters dialog that appears (see Figure 22)
allows you to select the computer to monitor (this can be a remote
server), a performance object, any specific counters, and an instance of
the counter, if applicable. You can select the Show Description check
box to get a simple explanation of the currently selected counter. When
you are done making your selections of counters to add, click OK to
return to the Performance Monitor screen.

You can customize the look of the lines in the chart
view by right-clicking and selecting Properties. On the Data tab of the
System Monitor Properties dialog, you can specify the color, width, and
style of line for each of your counters. You can also change the scale
of a counter’s value as well so that the line appears within the graph’s
scale of 1 to 100.
Tip
To quickly rescale all the counters, select all the
counters in the bottom panel of the Chart view window, right-click, and
select Scale Selected Counters. Performance Monitor automatically
selects a scale for each counter such that all lines appear within the
display.
To remove a counter, you simply highlight the line in
the bottom area of the Chart view window and press the Delete key or
click on the X button in the toolbar. If you just want to
temporarily hide a counter to make the display a little less busy, you
can right-click a counter in the bottom area of the Chart view and
select Hide Selected Counters.
The Chart view also provides a way to make a specific
counter or set of counters stand out in the display by making the line
or lines black and bold. This capability can help you focus on the trend
of a specific counter. To turn on highlighting, select one or more
counters in the bottom area of the Chart view and click on the Highlight
button on the toolbar (the one that looks like highlighter pen just to
the right of the big red X).
Adding counters like this in an ad hoc
manner is fine for a quick monitoring session. However, after you close
the Performance Monitor tool, you lose the counters you have selected,
so they are not available the next time you open Performance Monitor.
Typically, you need to set up those counters you want to reuse or to
have running continuously or on a schedule that captures the performance
counters to a log file. To do this, you create one or more Data
Collector Sets.