2. SQL Server Utility
SQL Server 2008 R2 introduces a new multiserver
management tool named the SQL Server Utility. This new tool takes
performance monitoring in SQL Server to the next level by providing the
capability to monitor specific performance metrics for one or more SQL
Server instances in a single view from a single SQL Server instance. The
performance information is captured in a database, and you can view
this information in one convenient place from within the SSMS
environment.
Some basic setup is required to start using the SQL
Utility. You accomplish this basic setup by using the new Utility
Explorer available in SSMS. You click View on the SSMS menu bar and then
select Utility Explorer. This Utility Explorer has a tree-like
structure similar to the Object Explorer, and it integrates into the
SSMS environment in much the same way.
Note
The option to view the Utility Explorer is not available if you are running a version of SQL Server prior to SQL Server 2008 R2.
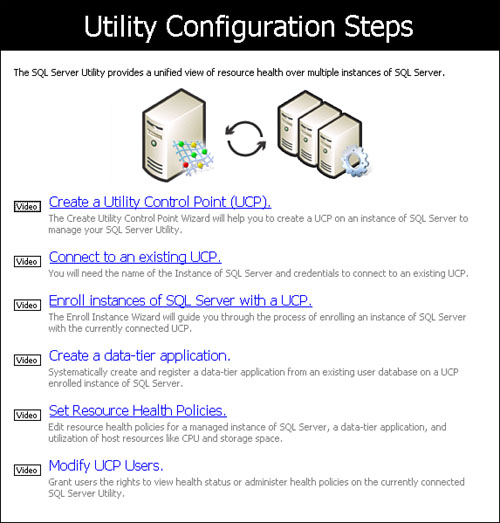
The first page displayed when you launch the Utility Explorer is shown in Figure 13.
This screen outlines all the utility configuration steps and is a handy
launch point into wizards that guide you through the setup process. You
can also click on the Video link next to each step to obtain further
help on configuring that step.

To
enable these capabilities, you only need to do the following:
1. | Create a utility control point.
|
2. | Connect to an existing UCP.
|
3. | Enroll instances of SQL Server into the UCP.
|
The UCP is a central repository for storing
configuration information and performance data for all the instances
that have been enrolled in the SQL Server Utility. Each SQL Server
Utility has only one UCP that you define by clicking on the first link
listed in the Utility Configurations Steps. A wizard guides you through
the creation.
Note
The SQL Server Utility collection set can work side
by side with non–SQL Server Utility collection sets, such as those set
up for data collection in the MDW. In other words, a managed instance of
SQL Server can be monitored by other collection sets while it is a
member of a SQL Server Utility. However, you must disable data
collection while the instance of SQL Server is being enrolled into the
SQL Server Utility.
In addition, after the instance is enrolled with the
UCP, when you restart the non–SQL Server Utility collection sets, all
collection sets on the managed instance upload their data to the utility
management data warehouse (UMDW), sysutility_mdw.
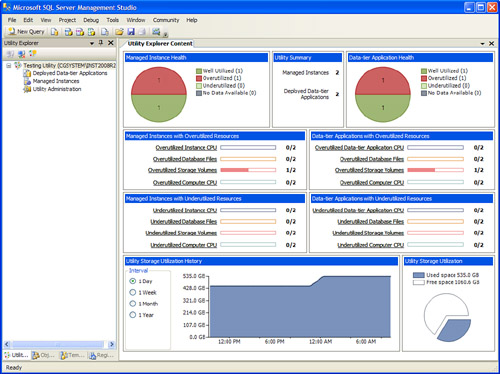
After you create the UCP, a new tab named Utility Explorer Content is displayed within the Utility Explorer (see Figure 14). This Utility Explorer window is also called the SQL Server Utility dashboard.
This dashboard is the main window for viewing performance metrics
captured by the SQL Server Utility. The information displayed on this
screen immediately after creating the UCP is the performance information
for the UCP itself. Each UCP is automatically a managed instance and
thus has performance data collected for it.

The following four performance utilization metrics
are captured by the SQL Server Utility and displayed on the Utility
Explorer Content screen:
CPU utilized by the SQL Server instance
Database file utilization
Storage volume utilization
CPU utilized by the computer running the instance
This performance data is broken down based on
utilization thresholds and displayed in the dashboard window based on
whether the specific metric is overutilized, underutilized, or well
utilized. This breakdown is created for each managed instance as well as
data-tier applications.
The key to making this performance information
valuable for you is defining the thresholds for each one of these
metrics. Overutilization or underutilization, to some degree, is a
matter of personal preference. A CPU that is at 70% utilization may be
considered overutilized for some but not for others. The thresholds for
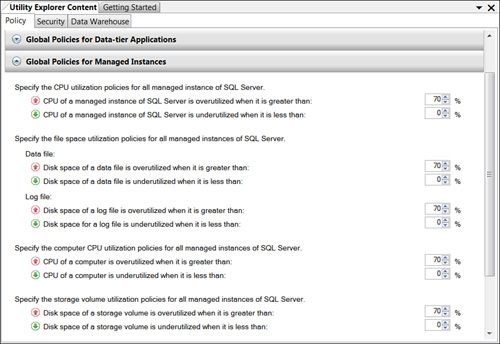
these metrics can be defined using the Utility Administration node in the Utility Explorer. Figure 15
shows the policy screen where the global policies for the managed
instances can be defined. These policies are essentially the thresholds
for each of the four performance categories displayed in the SQL Server
Utility dashboard.

The real power of the SQL Server Utility lies in its
capability to collect the kind of performance data that we have been
talking about for other SQL Server instances. This multiserver
management capability is easy to implement and simply requires that you
enroll the other SQL Server instances with a UCP. As mentioned earlier,
you can do this by using the third link on the Utility Configuration
Steps page. You can also right-click on the Managed Instances
node in the Utility Explorer and select Enroll Instance. The Enroll
Instance Wizard guides you through the enrollment steps. Upon completion
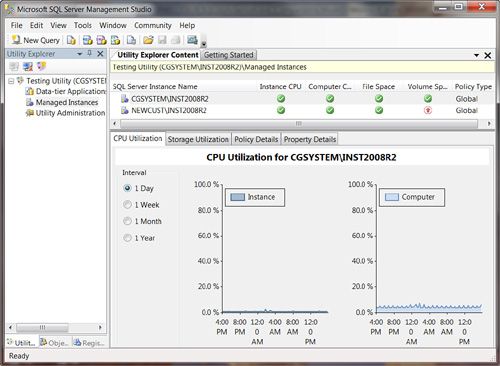
of the wizard, the new instance appears in the Utility Explorer Content
tab, as shown in Figure 16.

The
performance data collected by the SQL Server Utility is stored in the
utility management data warehouse. The UMDW is a database named sysutility_mdw
that is automatically created on the UCP instance when the UCP is
created. It can be viewed in the list of databases in Object Explorer.
By default, each managed instance enrolled in the UCP sends
configuration and performance data to the UCP database every 15 minutes.
The frequency of data collections provides for a comprehensive set of
historical information. This data can be viewed in the Utility Explorer
across different intervals, including daily, weekly, monthly, and yearly
views. These views provide a sound foundation for identifying problems
or identifying trends that can lead to problems in the enrolled SQL
Server instances.
Caution
The frequency of collection of data in the
UMDW database can also lead to a large database. Make sure that you
monitor the size of the sysutility_mdw database over time. You
can manage the data retention period through the SQL Server Utility
Explorer. Click on Utility Administration and then select the Data
Warehouse tab. You can drag the slider to change the retention period
from the default value of one year to one, three, or six months if the
UMDW database is becoming too large.