The System Data Collectors
When the Configure Management Data Warehouse Wizard is finished, you should see three additional nodes under the Data Collector node: Disk Usage, Query Statistics, and Server Activity.
You can double-click each node, or right-click and select Properties,
to open the Properties window. The Properties window for the Disk Usage
Data Collector is shown in Figure 6.
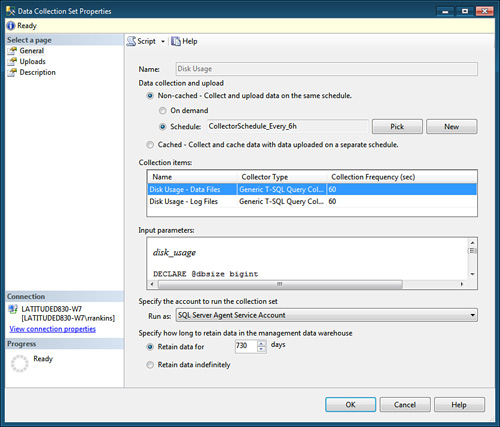
The main item you may want to change in the Data
Collection Set Properties window is the data collection and upload
schedule. By default, the wizard configures the Disk Usage Collection
set to run in noncached mode every six hours. Depending on how active
your server is, you might want to increase or decrease the frequency
that it runs. You can also configure how long it should retain data in
the MDW. By default, it is configured to retain data for two years (730
days). This is probably fine for keeping track of disk usage, but for
more active Data Collector Sets, you might want to reduce the retention
period to reduce the size of the MDW. For example, the default retention
period for the Query Statistics and Server Activity Data Collectors is
14 days.
Both the Query Statistics and Server Activity Data
Collectors are configured to cache data and upload to the MDW on a
separate schedule. If you look in the General page of the Data
Collection Set Properties window for these Data Collectors, you see that
the schedule Query Statistics Data Collector is to gather information
every 10 seconds, and the Server Activity collector gathers information
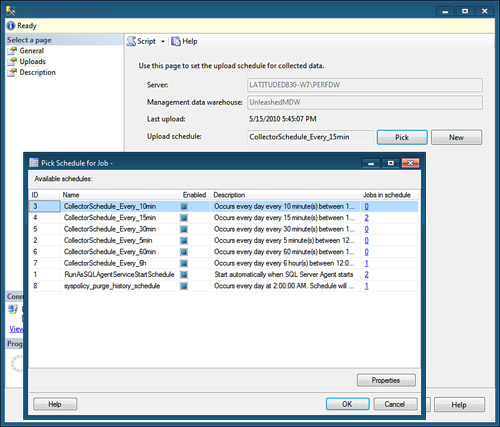
every 60 seconds. To view the upload schedule, click on the Uploads page
(see Figure 7). Both Data Collectors, by default, are configured to upload
the cached data to the MDW every 15 minutes. To change the upload
schedule, you can either pick from an existing schedule or create a new
one (Figure 39.8 shows the Pick Schedule list). The Upload Properties page also displays the last time the cached data was uploaded to the MDW.
In very active servers, the Data Collector can
generate a lot of data, and its storage tables can fill up with millions
of rows within hours. You might want to modify the collector job
schedules and decrease the frequency of data collections depending on
the use of each server and your monitoring requirements.
Note
Data collection for the built-in system collection
sets begins automatically after the Configure Management Data Warehouse
completes. Depending on how active your servers are, it likely will take
awhile for some meaningful data to accumulate. You might want to wait
an hour or so before looking at the reports.
Data Collector Reports
After you set up data collection, SQL Server
Management Studio provides three new reports for viewing data
accumulated by the Data Collector: Server Activity History, Disk Usage
Summary and Query Statistics History. You can view these reports by
right-clicking on the Data Collection node and selecting
Reports, and then select Management Data Warehouse. From there, you can
choose one of the three built-in reports:
Disk Usage Summary— Displays data and log file sizes (starting size and current size) and average daily growth
Query Statistics History—
Displays query execution statistics including the top 10 queries by
CPU, Duration, Total I/O, Physical Reads, and Logical Writes
Server Activity History—
Displays performance statistics in four general areas: CPU %, Disk I/O
Usage, Memory Usage, and Network Usage, plus SQL Server Wait statistics
by wait type and SQL Server activity
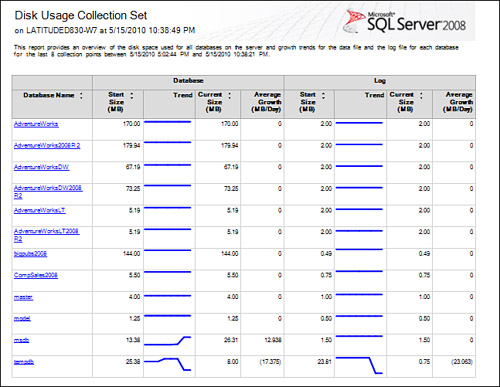
Figure 8
displays an example of the Disk Usage Summary Report. All the data
collection reports provide drill-down capabilities on just about every
data element and widget displayed in the main report. For example, in
the Disk Usage Summary report, you can click on the database name to
display a more detailed breakdown of the disk usage for that specific
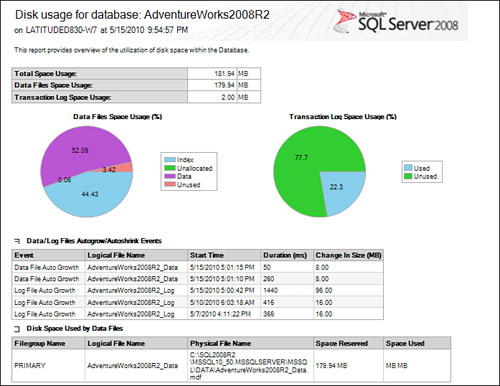
database. Figure 9 shows the Disk Usage details for the AdventureWorks2008R2
database. If you click on the Trend graph or the current database or
log size, it displays a more detailed graph showing the growth trends
for the database over time since the data collection session started.
If you want to run reports for any of the monitored servers without having navigate to the Data Collection
node for each server instance, you can open the server instance that
hosts the MDW. Browse to the MDW database in the SSMS Object Browser and
right-click on that database. Then select Reports and select the the
Management Data Warehouse Overview report (see Figure 10).
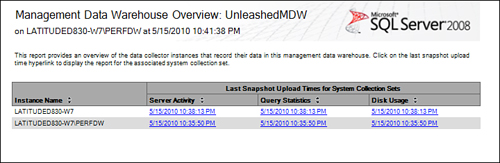
The Management Data Warehouse Overview report lists
which servers the data collection is running on and shows the most
recent times data was uploaded for each of the collection sets. You can
click on the hyperlinks below each of the listed collection sets to
bring up that corresponding report for that server. For example, if you
click on the link below Server Activity for the LATITUDED830-W7 server,
it displays the Server Activity History report, as shown in Figure 11.
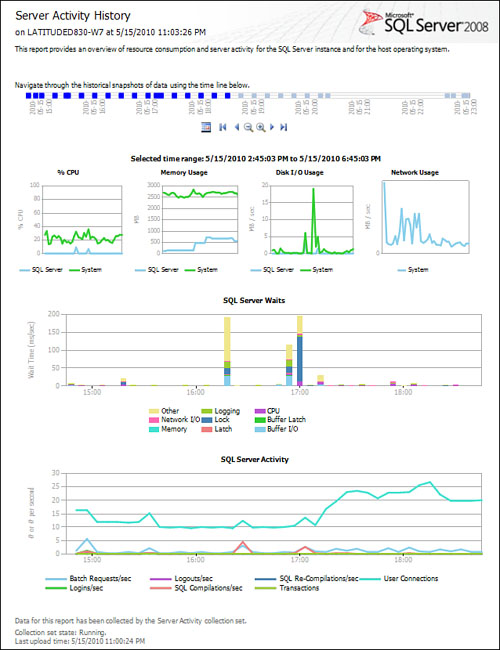
Like the Disk Usage report, most of the data elements
in the Server Activity History report are hyperlinks that let you drill
down into more detail. For example, you can click in the line in the
Disk I/O Usage graph to bring up additional detail by disk of the Disk
Response Time, Average Disk Queue Length, Disk Transfer Rate, as well as
the average, minimum, and maximum I/O reads and writes for the
processes running during the data collection session.
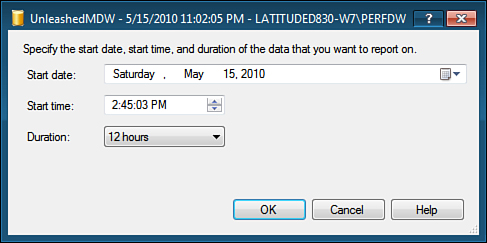
If you want to narrow down the report to a specific
time frame, you can click on a point in the timeline shown on the report
to set the end time of the data displayed. You can click on the
magnifying glass to increase or decrease the size of the interval
displayed and click the arrow buttons to move to the next or previous
interval. For finer control over the time period displayed, click on the
calendar icon to bring up the dialog shown in Figure 12.
Here, you can set the specific start time and choose an interval (15
minutes or 1, 4, 12, or 24 hours) to display from that start time.
The Data Collector reports contain a lot of
data, especially if you drill down into the details. You should plan
to spend some time examining each of these reports by drilling down into
the various details and selecting different time frames and so on to
get familiar with what they have to offer. For example, you can drill
from the Query Statistics History report to the individual query
details, including the graphical execution plan.
