Troubleshooting Network Connectivity
Ping
The
ping utility uses ICMP echo commands to test IP connectivity. Some
firewalls and routers filter out ICMP packages, and you cannot ping
across them. In spite of this limitation, ping remains one of the most
useful and widely used troubleshooting tools. You can test that TCP/IP
is correctly installed on a host by pinging the loopback address
127.0.0.1. You can ping all the interfaces on your local computer. You
can ping another host on your subnet by both IP address and hostname to
test connectivity and name resolution. You can ping all the servers that
you need to connect to. Finally, you can ping a host on a distant
subnet to test internetwork connectivity.
Ping lets you set a number
of parameters to specify, for example, the size of the ping packets, how
many packets to send, whether to record the route used, what
time-to-live (TTL) value to use, and whether to set the “do not
fragment” flag. If you open the Command console and enter ping /? you can obtain details about these options.
For example, ping -n 6 -1 2000 -w 10000 10.0.10.100
pings the host with IP address 10.0.10.100 six times using a ping
packet 2,000 bytes in size. By default, ping waits for up to 4,000
milliseconds for each response to be returned before it displays the
“Request Timed Out” message. If you are pinging a remote system across a
slow link, then you can use the –w (wait) option to specify a longer
timeout. In the example given, the timeout is 10 seconds.
Arp
You can use the arp
command-line utility to manage the ARP cache, which is a table that
stores IP address/MAC address pairs. Whenever a source computer resolves
a target IP address using an ARP request broadcast, the address pair
for the target computer is stored in the source computer’s cache.
Similarly, when a target computer responds to an ARP request with an ARP
reply, the address pair of the source computer is stored in the target
computer’s cache. Cache entries generated automatically by ARP
resolution are called dynamic entries. They remain in the cache for a
specified TTL (2 minutes by default) and, if not accessed during that
time, are then discarded. If an entry is referenced again before it is
removed, its TTL is increased by another two minutes. Thus, a frequently
referenced entry can increase its TTL up to a maximum of 10 minutes.
Address pairs for
frequently accessed targets, such as default gateways or member servers,
can be entered manually. Manually entered address pairs are called
static entries; they persist in cache until the host is rebooted or
until they are manually deleted.
Tip
Static arp cache entries are deleted on reboot. If you want them to be persistent, create a startup script that re-enters them. |
Nbtstat
Network
basic input/output system (NetBIOS) over TCP/IP (NetBT) resolves
NetBIOS names to IP addresses. TCP/IP provides many options for NetBIOS
name resolution, including local cache lookup, WINS server query,
broadcast, DNS server query, and Imhosts and hosts file lookup. In
theory, DDNS is the main name resolution method in native mode Windows
2003 and Windows 2000 Active Directory domains, and NetBT can be
disabled. In practice, many services and BackOffice products (for
example, Systems Management Server) use NetBT. You need to investigate
very carefully if you want to remove it.
You can use the
nbtstat command-line utility to troubleshoot NetBIOS name resolution
problems. The available options are as follows:
nbtstat -n Displays the names that were registered locally on the system by programs such as the server and redirector.
nbtstat -c Shows the NetBIOS name cache, which contains name-to-address mappings for other computers.
nbtstat -R Purges the name cache and reloads it from the lmhosts file.
nbtstat -RR Releases NetBIOS names registered with a WINS server and then renews their registration.
nbtstat -a name Performs a NetBIOS adapter status command against the computer specified by name. The adapter status command returns the local NetBIOS name table for that computer plus the MAC address of the adapter.
nbtstat -S Lists the current NetBIOS sessions and the status of each, including statistics.
Note
The nbtstat utility was developed for UNIX and is case-sensitive. |
Netstat
You can use the
netstat command-line utility to display protocol statistics and current
TCP/IP connections. The available options are as follows:
netstat -a Displays all connections.
netstat -r Displays the route table plus active connections.
netstat -o Displays process identities so that you can view the port owner for each connection.
netstat -e Displays Ethernet statistics.
netstat -s Displays per-protocol statistics.
netstat -n If you use this option, addresses and port numbers are not converted to names.
Tracert
You can use the
tracert command-line utility to determine the path that an IP datagram
takes to reach a destination. The utility uses the IP TTL field and ICMP
error messages to determine the route from one host to another through a
network. Because it uses ICMP, tracert will not work across firewalls
and routers that block ICMP frames. You can try tracert www.microsoft.com.
This may or may not work depending on the route the IP datagram takes
to its destination. You can also use tracert to trace the path of a
datagram through your intranet. The utility is useful for
troubleshooting large networks where several paths can be taken to
arrive at the same point. The tracert command has the following syntax:
tracert [–d] [–h
maximum_hops] [–j
host-list] [–w
timeout]
target_name
The options are described in Table 2.
Table 2. Tracert Command-Line Options
| Option | Description |
|---|
| –d | Specifies that IP addresses are not resolved to host names. |
| –h maximum_hops | Specifies the number of hops to allow in tracing a route to the host named in target_name. |
| –j host-list | Specifies the list of router interfaces in the path taken by the tracert utility packets. |
| –w timeout | Waits the number of milliseconds specified by timeout for each reply. |
| target_name | Name or IP address of the target host. |
Pathping
The pathping utility is a
route tracing tool that combines the features of ping and tracert and
gives additional information that neither of those tools provides. The
utility sends packets to each router on the way to a final destination
over a period of time and then computes results based on the packets
returned from each hop. Because the command shows the degree of packet
loss at any given router or link, you can determine which routers or
links might be causing network problems. A number of options are
available, as shown in Table 3.
Table 3. Pathping Options
| Option | Name | Function |
|---|
| –n | Hostnames | Does not resolve addresses to host names. |
| –h | Maximum hops | Maximum number of hops to search for target. |
| –g | Host-list | Loose source route along the host list. |
| –p | Period | Number of milliseconds to wait between pings. |
| –q | Num_queries | Number of queries per hop. |
| –w | Time-out | Pathping waits this many milliseconds for each reply. |
| –i | address | Instructs pathping to use the specified source address. |
| –4 | IPv4 | Forces pathping to use IP version 4. |
| –6 | IPv6 | Forces pathping to use IP version 6. |
The default number of
hops is 30, and the default wait time before a timeout is three
seconds. The default period is 250 milliseconds, and the default number
of queries to each router along the path is 100.
When you run pathping,
you first see the results for the route as it is tested for problems.
This is the same path that the tracert command shows. The pathping
command then displays a busy message typically for the next 125 seconds
(this time varies depending upon the hop count). During this time,
pathping gathers information from all the routers previously listed and
from the links between them. At the end of this period, it displays the
test results.
Practice: Managing the ARP Cache and Analyzing an ARP Packet
In this practice, you
manage the ARP cache and use Network Monitor to capture and analyze an
ARP packet. As did the previous practice, this practice assumes that
Network Monitor has been installed and that this is not the first time
it has been used.
Exercise 1: Manage the ARP Cache
To manage the ARP cache on Server01, perform the following steps:
1. | On Server01, open the Command console.
|
2. | Enter arp. When entered with no arguments, the utility lists the command syntax (as does arp /?).
|
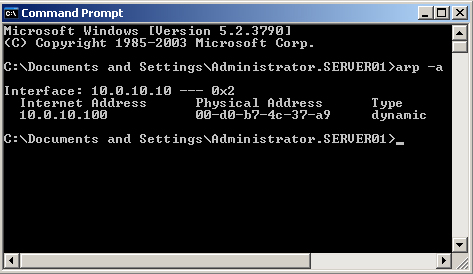
3. | Enter arp -a. This displays the current ARP cache, as shown in Figure 5.
|
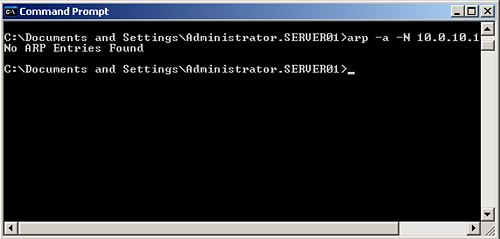
4. | Because Server01 is multihomed, you can use the interface addresses to display the ARP cache for each interface. Enter arp -a -N
ip_address, where ip_address is the IP address of Local Area Connection on Server01, as shown in Figure 6.
|
5. | Enter arp -d without arguments to delete all cache entries.
Note The command arp -d
ip_address will delete an individual cache entry. |
|
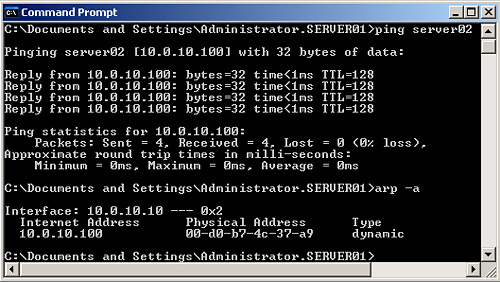
6. | Enter ping server02.
|
7. | Enter arp-a to display the IP address/MAC address pair that the ping operation places in the arp cache, as shown in Figure 7.
|
8. | Frequently
accessed machines on your subnet, such as the default gateway, should
be placed in the ARP cache as static entries. Enter arp -s 10.0.10.1 00-d0-b7-4c-56-a8 to add a static entry. Both the IP address and the MAC address in this step are examples and their values are not significant.
|
9. | Enter arp-a to view the ARP cache. Both the static and dynamic entries should be present.
|
10. | Wait for approximately 10 minutes, and then enter arp -a
to list the ARP cache entries. The dynamic entry is removed because its
TTL has expired. The static entry will remain until Server01 is
rebooted.
|
11. | Static entries can, however, be removed using the arp -d command. Enter this command to clear the ARP cache.
|
Exercise 2: Use Network Monitor to Display the Contents of an ARP Broadcast Frame
Before you start this
exercise, ensure that the ARP cache is clear. If it holds entries for
Server02, then the broadcast frames that you want to analyze will not be
sent.
To use Network Monitor to display the contents of an ARP broadcast frame, perform the following steps:
1. | On Server01, open Network Monitor. On the Capture menu, click Start.
|
2. | Do not close Network Monitor. On Server01, open the Command prompt and enter ping server02.
|
3. | In Network Monitor, on the Capture menu, click Stop And View.
|
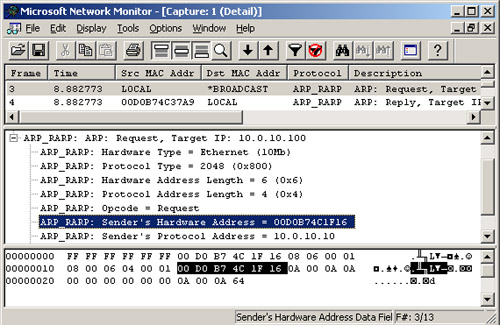
4. | There
should be two ARP-RARP frames at or near the top of the list in the
Summary pane. (Note that Network Monitor calls ARP frames ARP-RARP,
where RARP stands for Reverse ARP.)
Click on the Request frame (the first one), expand the list in the
detail pane, and read the source IP and MAC addresses, as shown in Figure 8.
|
5. | Analyze the Reply ARP-RARP frame in the same way. |
