Windows 7 offers two valuable tools for monitoring the performance of your system
in real time. The first of these, Windows Task Manager, has been around
through many versions of Windows . In addition to showing you what
applications, processes, and services are running (and giving you a way
to terminate recalcitrant items), it offers performance graphs that show
a minute's worth of CPU usage, memory usage, and network capacity
usage. By adding nondefault columns to the Processes tab of Windows Task
Manager, you can examine per-process details in depth.
For zeroing in on performance issues with extraordinary levels of detail, Windows 7 offers an advanced tool called Resource
Monitor. This utility debuted in Windows Vista but has received a
top-to-bottom makeover in this release.
Resource Monitor allows you to keep an eye on different aspects of your
system simultaneously, and it also allows you to isolate processes and
look at exactly how and where they're using CPU, memory, disk, and
network resources.
1. Using Windows Task Manager
Windows Task Manager pops up in response to the keyboard
shortcut Ctrl+Shift+Esc. (You can also press Ctrl+Alt+Delete and then
choose Start Task Manager.) Task Manager's instant accessibility is one
of its more endearing traits, especially when something appears to have
gone awry. Its executable file, Taskmgr.exe, runs at a Base Priority of
High, allowing it to kick into action even when another program running
at Normal priority is refusing to surrender control. If you need to stop
an application (or process) that doesn't respond to the usual measures,
or if your system suddenly slows down and you want to know who's eating
your processor cycles, Windows Task Manager is your best friend.
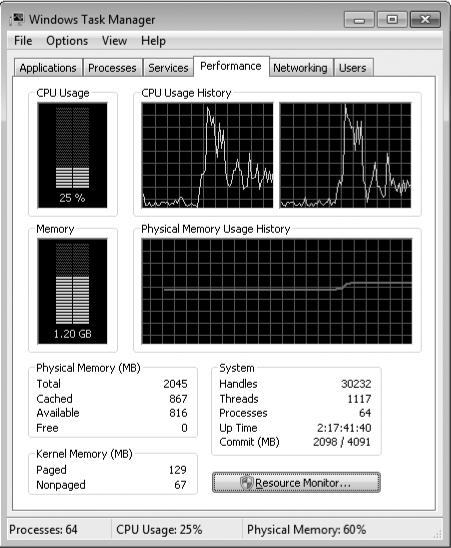
The Performance tab of Windows Task Manager, shown in Figure 1, gives you a quick overview of CPU and memory usage. The bar graphs at the left report current data—the percentage of your CPU's capacity and the amount of physical memory
(in gigabytes) in use—while the line graphs to the right show (by
default) one minute's worth of data, with updates at one-second
intervals. In Figure 1,
for example, the Memory bar graph shows that 1.20 GB are currently in
use, while the Physical Memory item in the status bar at the bottom of
the window reports that 60 percent of the system's available RAM is in
use. The CPU Usage History and Physical Memory Usage History line
graphs, meanwhile, make it clear that we have opened several large
applications in rapid succession within the last minute.

Numbers below the
graphs amplify the graphical presentation.
To change the update
speed (and therefore the duration of the line graphs), choose View,
Update Speed. The Normal option on this menu updates the display once
per second; High switches to double that pace, and Low changes the
display to update every 4 seconds. Use this command's Paused option to
freeze all the Performance graphs. If the Task Manager display is
paused, you can force an update at any time (without resuming continuous updating) by choosing View, Refresh Now or by pressing F5.
If you have a multiprocessor system (one using a dual-core or quad-core
CPU, for example), you can choose between seeing a single line graph
that represents all processors or separate graphs for each. Use commands
on the View, CPU History submenu to switch between these alternatives.
By default, Windows Task Manager stays on top of other open windows even when another window has the focus. Choose Options, Always
On Top to toggle that behavior on or off. Regardless of what settings
you choose on the View menu, Windows Task Manager displays, in the
notification area, a miniature version of the CPU Usage bar graph. You
can minimize Windows Task Manager and still keep an eye on CPU usage by
glancing over at the notification area as you work. (Be aware, though,
that continuous monitoring of your system performance by means of
Windows Task Manager—or any other real-time tracking tool—will itself
consume some of your processor time.)
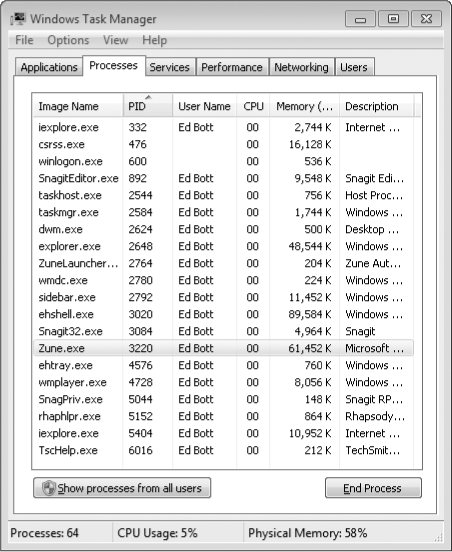
In its default view, the Processes
tab lists programs and services that are directly accessible to the
user. Note that in the example shown here 64 processes are currently
running (as evidenced by the value in the lower left corner of the
status bar at the bottom of the dialog box). So why does the list
display only 20 entries?

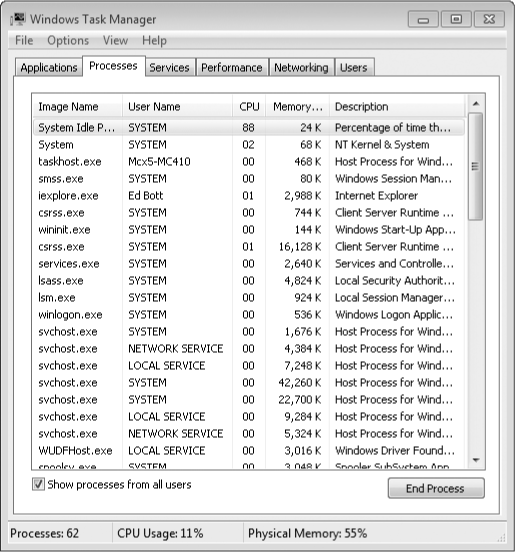
The short list shows only processes that were started by and can be directly controlled by the current user account. If you click Show Processes
From All Users (and if necessary provide the required administrative
credentials), the list expands to include all currently running
processes. In the example shown here, the entries in the User Name
column now include the currently logged-on user (running Internet
Explorer) as well as a Media Center Extender account (its automatically
generated account name begins with Mcx) and the built-in System, Network
Service, and Local Service accounts:

On a system running a 64-bit version of Windows 7, the Image Name column includes 32-bit and 64-bit
processes. Each 32-bit process on such a system is identified by the
*32 label at the end of its entry in the Image Name column.
For each process, Windows Task Manager includes the following information by default:
Image Name The name of the executable file for the process
User Name The name of the user account that started the process
CPU The percentage of total CPU capacity that the process is currently using
Memory (Private Working Set) The amount of memory that is currently dedicated to the process and is not available for other applications to use
Description A descriptive name for the process, taken from the value stored in the File Description field of the executable file
|
Windows Task Manager
separates its display of what's running on your computer into two tabs.
The Applications tab lists each running program by name; the Processes
tab is a much longer list that shows every executable file that's
running, including child processes, services, and processes that run in
the background.
In Windows XP, you can
right-click on any item in the Applications list and choose Go To
Process from the shortcut menu. But once you reach the Processes tab,
you're at a dead end. If a process is sucking the life out of your CPU,
or if you find a mysterious process that you can't identify that you
think might be associated with malware, you're on your own. You have to
use search tools to find the file responsible for that process and then
figure out what it is.
Windows 7 (like
Windows Vista) simplifies this process. When you right-click any item in
the Processes list, you'll see several new choices on its shortcut
menu:
Click Open
File Location to open Windows Explorer and see the file responsible for
the running process. Often, just knowing which folder it appears in is
enough to help ease your mind about a process with a mysterious name. The
Properties menu choice, also new in Windows Vista and Windows 7, leads
directly to the properties dialog box for the associated file, where a
greatly expanded Details tab includes copyright information and other
relevant text drawn from the file itself. That information can help you
decide whether a file is legitimate or needs further investigation. Finally,
for processes that are running as Windows services, you can click the
Go To Service(s) option, which takes you to the Services tab and
highlights all of the individual services associated with that process.
For an instance of Svchost.exe, the list might number a dozen individual
services.
|
Processes are sorted
initially by the order in which they were started, with the most recent
entries at the top. You can sort by any column by clicking the column
heading (click a second time to reverse the sort order). Clicking the
Memory or CPU
heading to sort in descending order is a good way to identify processes
that are using more than their fair share of memory or CPU time.
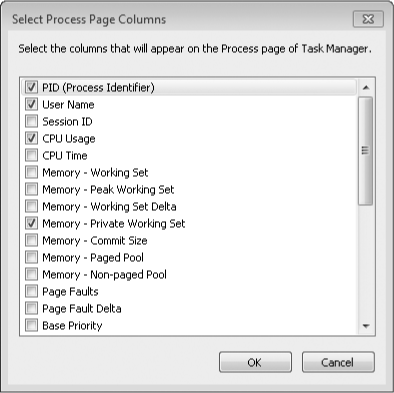
With a modest amount of work, you can customize the Processes tab so that it shows far more information about each running process than the lean default view. To change the columns displayed on this tab, choose View, Select Columns, and then add or remove entries from the dialog box shown here:

Most of these columns
correspond to entries available in Resource Monitor (which we cover in
detail in the next section). After selecting the columns you want to
see, click OK. You can then rearrange the display by dragging column
headings to the left or right and dragging the border of any column
heading to change its width. If necessary, resize the Task Manager
window to see more data.
The default arrangement of columns on the Processes tab does not include the Process Identifier (PID) column. This column is shown on the Services
tab, where it's extremely useful in enabling you to see which processes
are running as part of the same Svchost.exe instance. For detailed
troubleshooting or performance analysis, we recommend that you display
this column on the Processes
tab. To find out what's inside a particularly busy Svchost process,
make a note of its PID and then switch to the Services tab and sort by
the PID column. The associated services will appear in a block using
that PID.